Viewing agent details in Cloudera Edge Management
Learn how to check individual agent details, monitor alerts, view configurations, check status, and track the history of triggered commands.
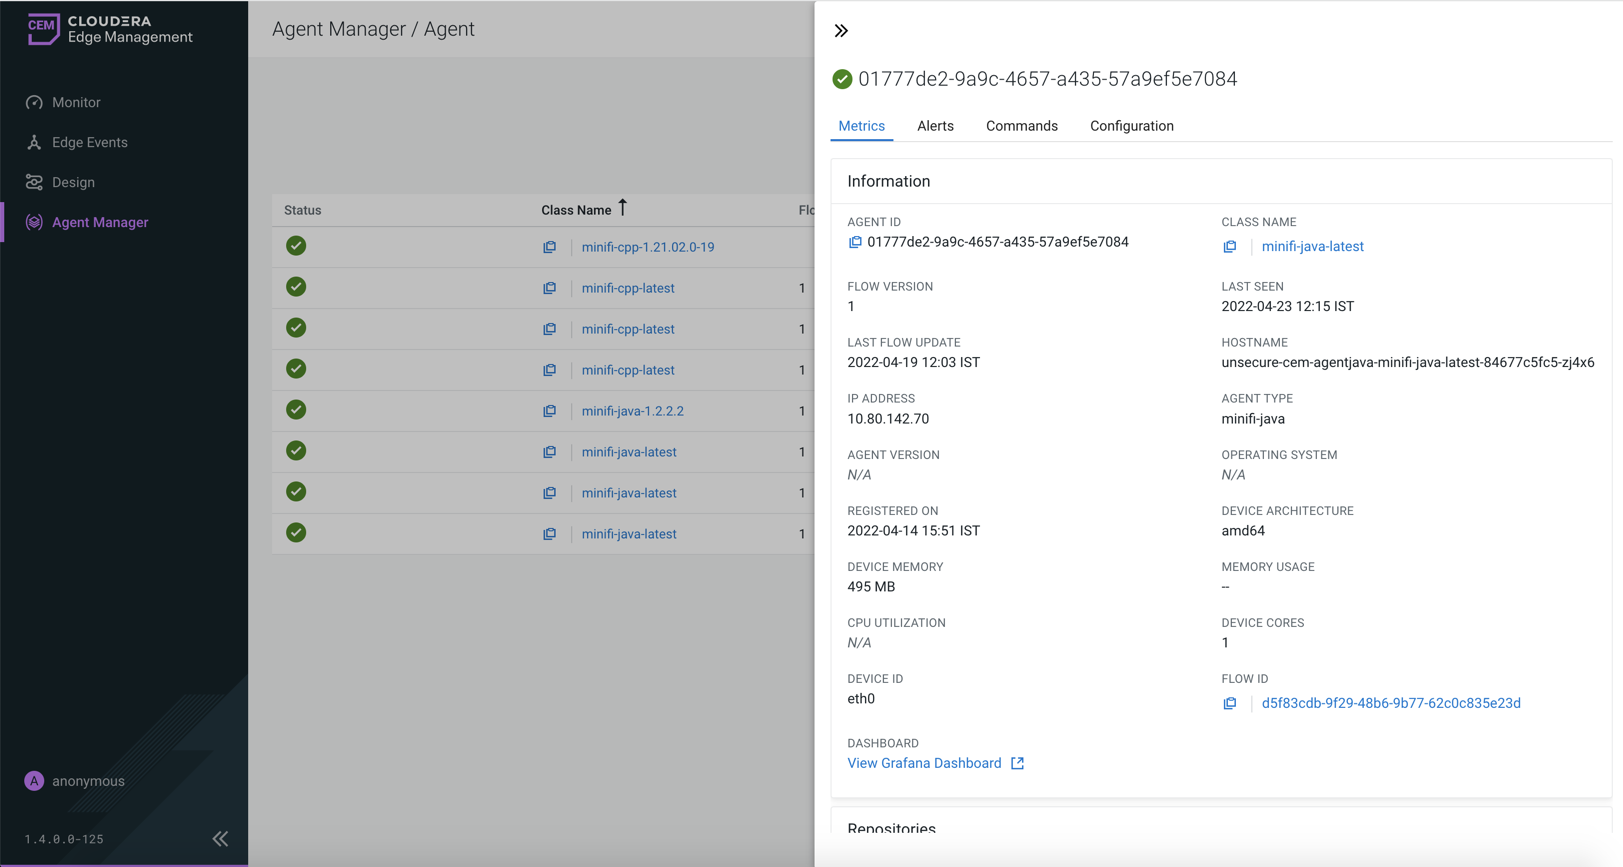
Metrics tab
It displays runtime metrics for the agent.
- Agent Details
-
Provides basic information about the agent.
- Agent ID – Unique identifier of the agent
- Class name – Agent class the agent belongs to
- Agent Type – Type of agent (for example, Java or C++)
- Agent Version – Version of the agent
- Last Seen – Last time the agent sent a heartbeat
- Registered On – Timestamp when the agent was registered
- Device Details
-
Provides information about the host system running the agent.
- Hostname – Name of the host machine
- IP address – Network address of the host
- Operating system – OS of the host
- Device architecture – CPU architecture (for example, amd64)
- Device memory – Total memory of the host (if available)
- Agent Memory Usage – Memory currently used by the agent
- Agent CPU Utilization – CPU usage of the agent (if available)
- Device CPU Load Average – System load average
- Device CPU Utilization – Overall CPU usage (if available)
- Device Cores – Number of CPU cores
- Device ID – Identifier of the network interface
Some metrics may not be available depending on the agent type and version.
- Flow Definition
-
Provides information about the flow assigned to the agent.
- Flow ID – Identifier of the assigned flow
- Published Flow Version – Currently deployed flow version
- Last Flow Update – Timestamp of the last update
If no flow is published, the UI indicates that no version is available.
- Repositories
-
Displays storage usage for agent repositories.
- FlowFile repository – Storage used for FlowFiles
- Provenance repository – Storage used for provenance data
Usage indicators help you monitor resource consumption on the agent.
- Connection Queues
-
Displays all connections used in a given agent accompanied by its metrics.
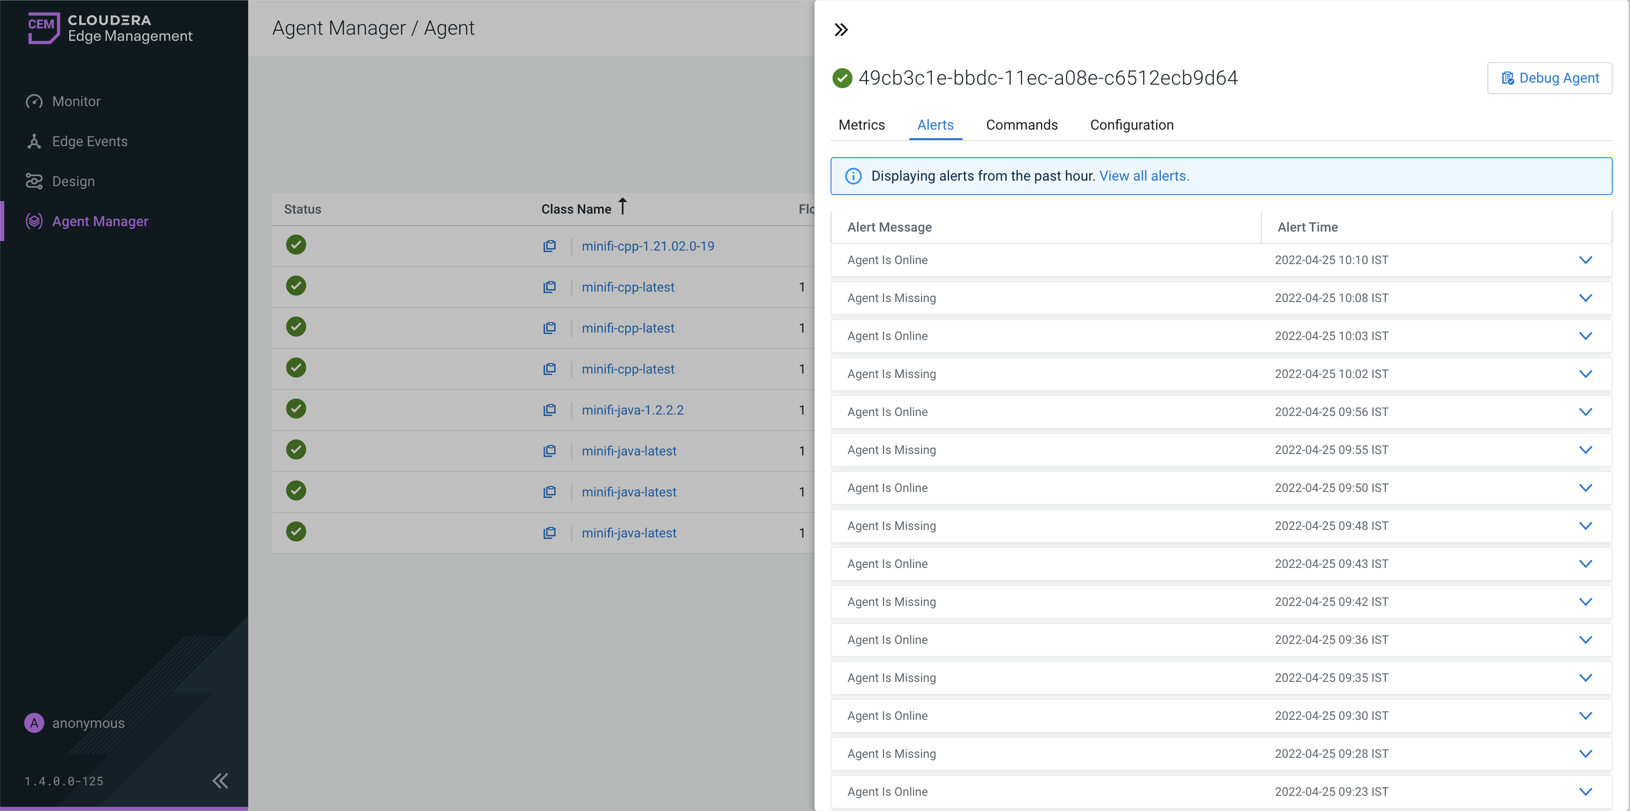
Alerts tab
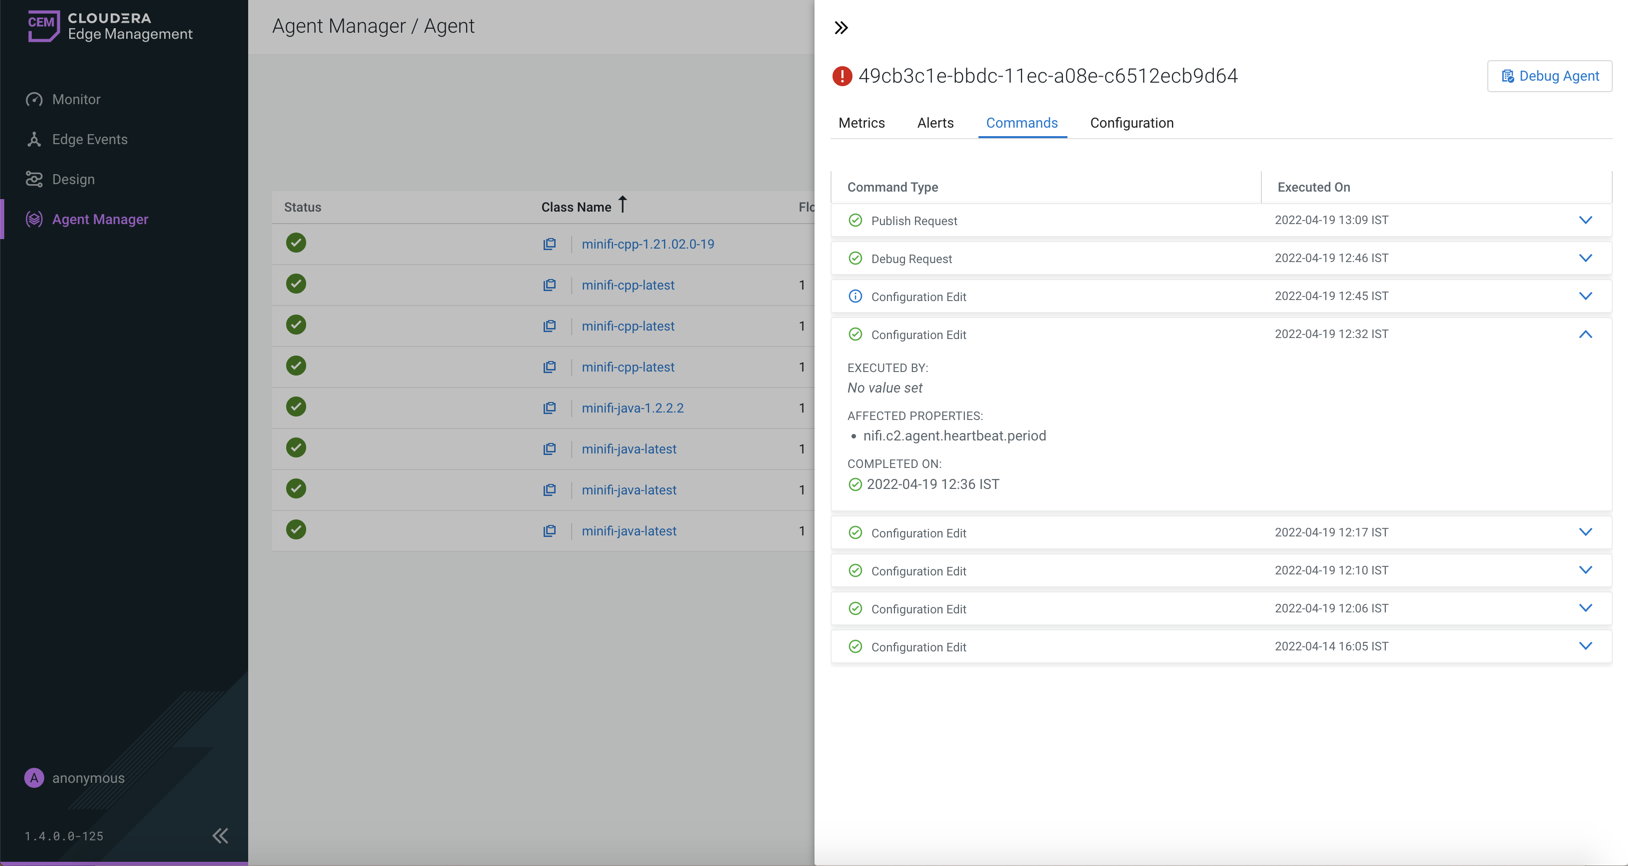
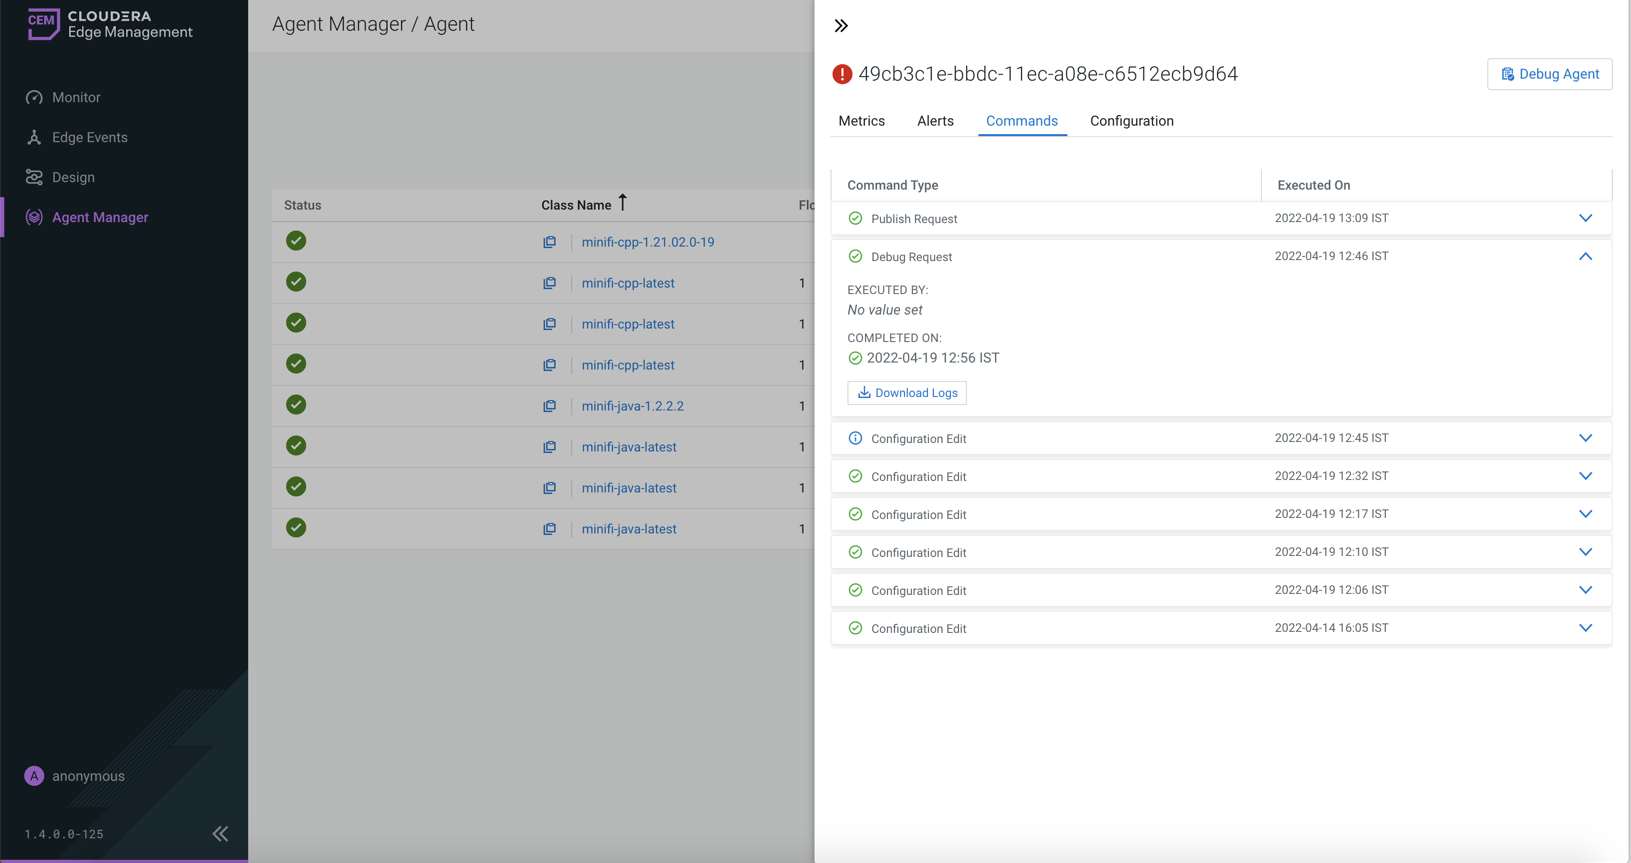
Commands tab
It lists commands executed on the agent. You can check the last 20 commands sent to the agent along with their statuses.
You can customize the number of displayed items using the
efm.agentManager.commands.displayLimit property in the
efm.properties file.
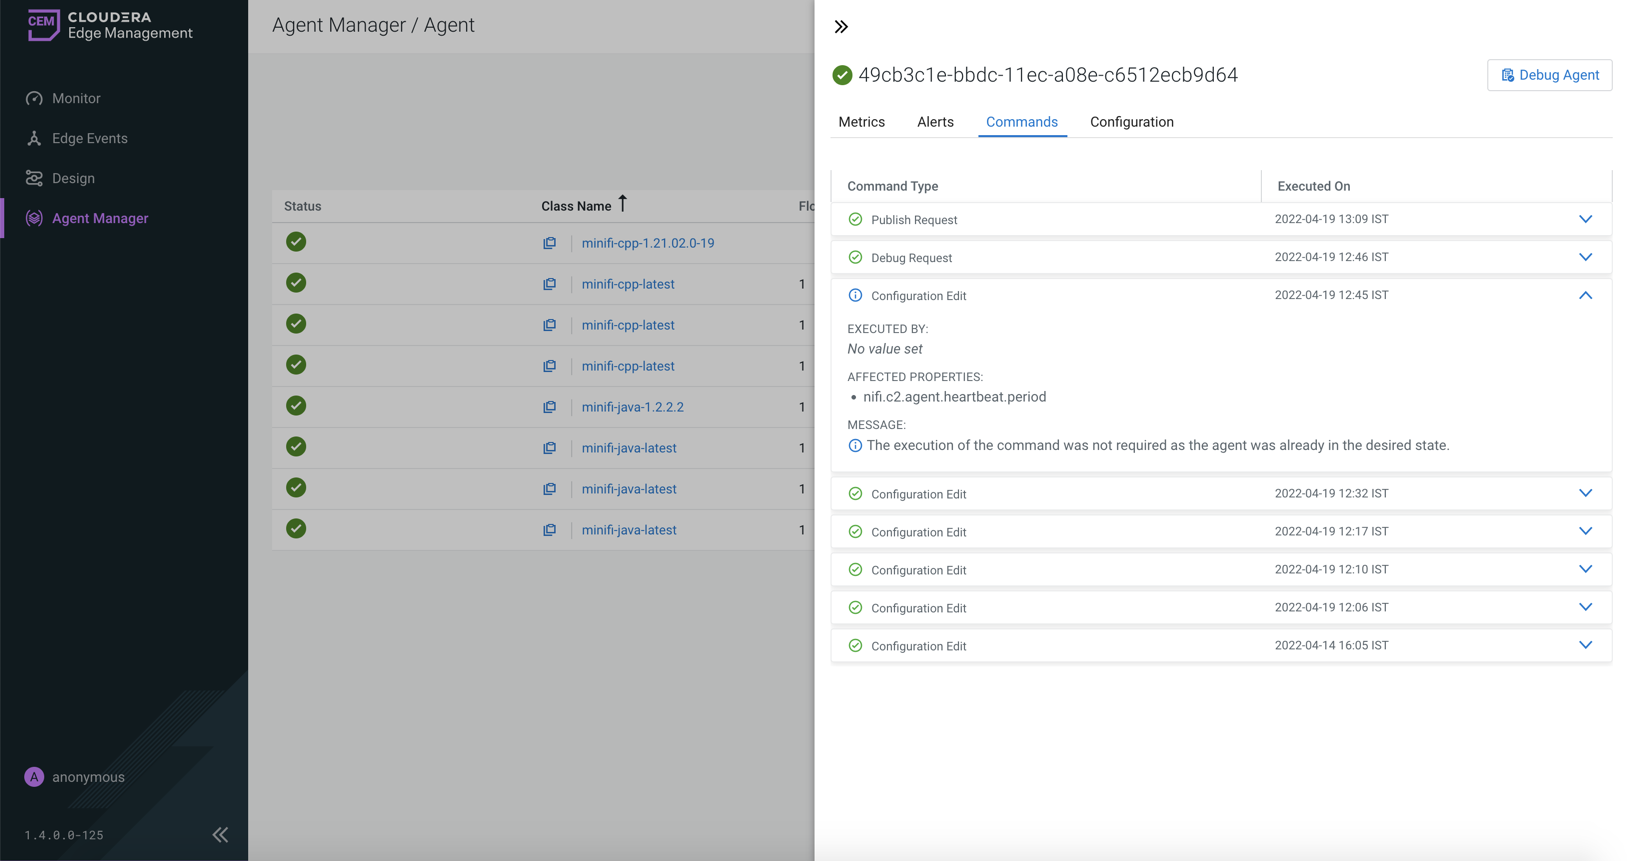
The details view may vary depending on the type of the command. For example, for Configuration Edit, you can check the affected property name, as shown in the following image:
If no update was required on the agent and the given agent had the new value already, you can see The execution of the command was not required as the agent was already in the desired state. message.
For debug requests, you are prompted with a Download Logs button to download the debug bundle retrieved from the agent, as shown in the following image:
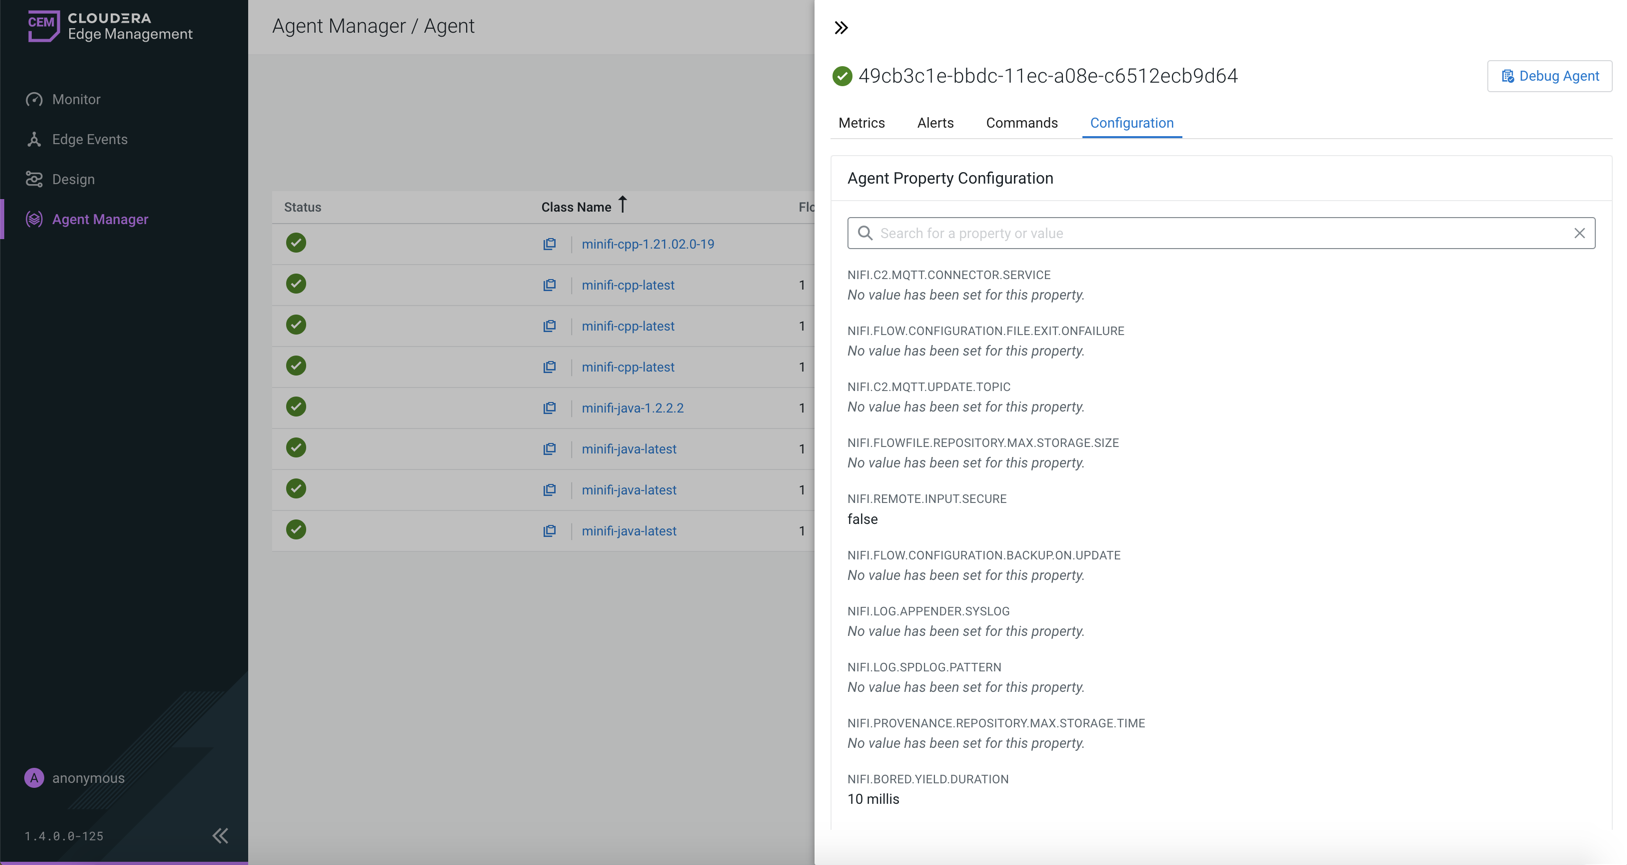
Configuration tab
It displays the agent configuration. You can review the property configuration of an agent, provided the selected agent supports this functionality. Properties displayed can be filtered by both name and value.
Cloudera Edge Management also supports editing properties at agent class level. For more information, see Monitoring deployments in Cloudera Edge Management.