In addition to the generic configuration,
you
can configure scheduling and available resources for the Activity Profiler.
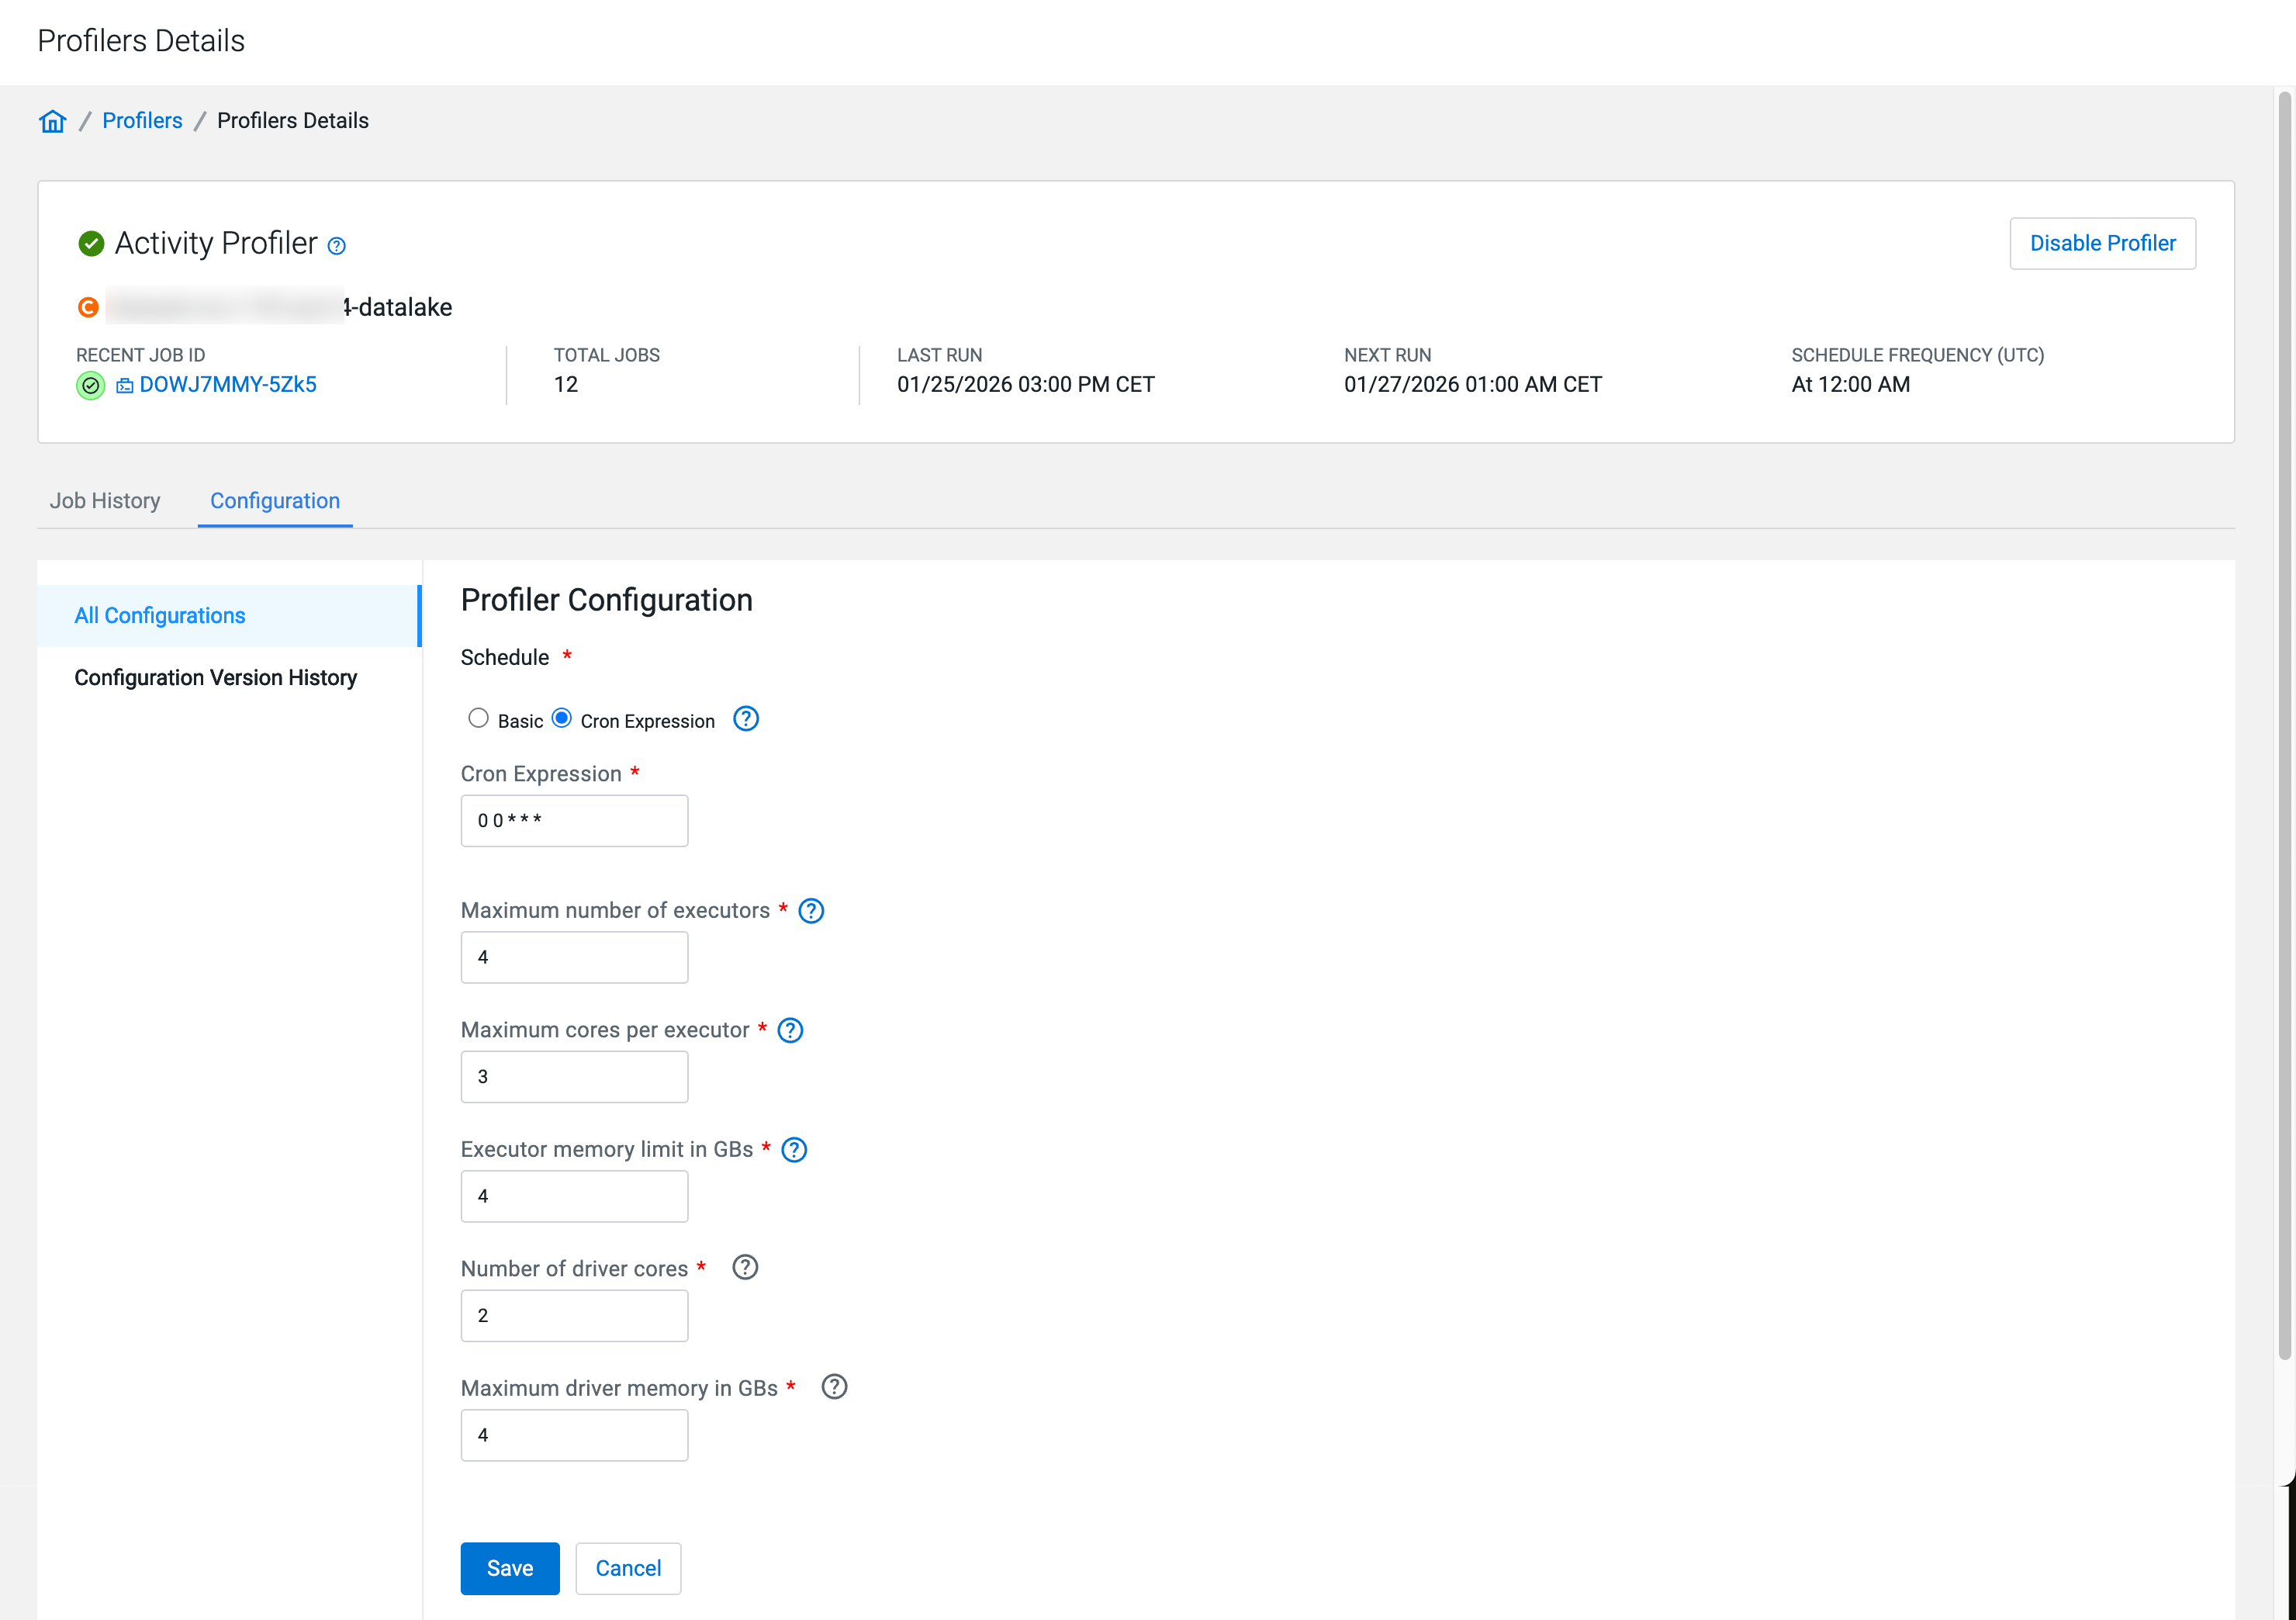
Go to Profilers and select your data lake.
Go to Profilers > Activity Profiler > Profiler Details > Configuration > All Configurations
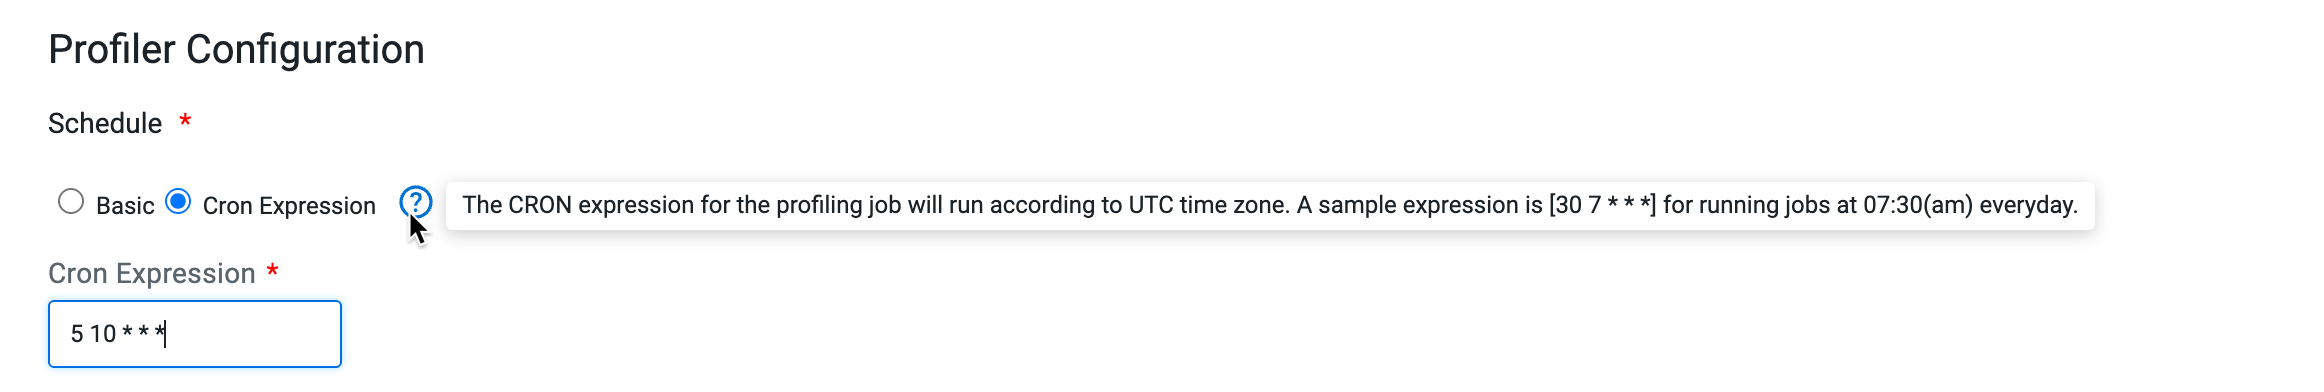
Select a schedule to run profiler using either UNIX Cron
Expression or the Basic scheduler.
Figure 1. Profiler schedule with cron expressionFigure 2. Profiler schedule with natural language
Configure
the
resources.
Set the Maximum number of
executors.
Specifies
the number of processes that are used by the distributed computing
framework. The recommended value is at least four executors.
Set the Maximum cores per
executor.
Specifies
the maximum number of cores that can be allocated to an
executor.
Set the Executor memory limit in
GBs.
Set the Number of driver
cores.
Specifies
the maximum number of driver cores. Increase the number of cores to
improve the speed of profiler job scheduling.
Set the Maximum driver memory in
GBs.
Specifies
the maximum amount of memory that can be allocated to an driver
core. Increasing the available memory accelerates the profiling of
larger and more complex tables and prevents out-of-memory
errors.
Click Save to apply the configuration changes to the
selected profiler.