Cloudera Data Visualization enables you to create Word Cloud
visuals.
Word Cloud visuals aggregate text data, and display the words with higher frequency of
occurrence. You can use them to emphasize prominent phrases or words in textual data. This
visual type includes many manual setting adjustments.
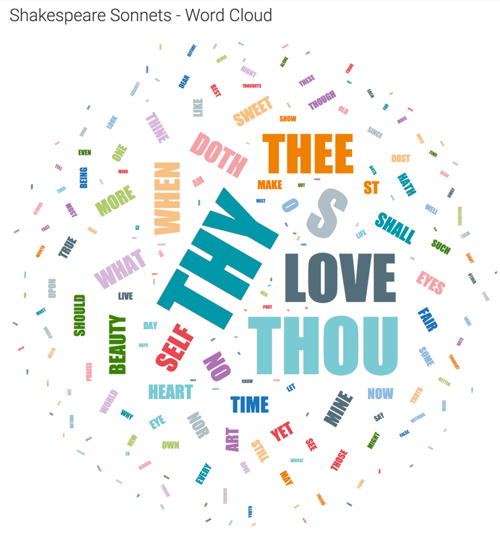
In the following example, the Shakespeare's Sonnets dataset is used. For an overview
of shelves that specify this visual, see Shelves for word cloud visuals.
Start a new visual based on the Shakespeare's Sonnets dataset.
For instructions, see Creating datasets and Creating a
visual.
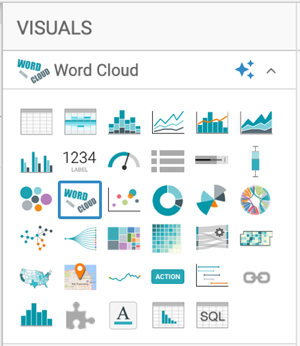
In the VISUALS menu, find and click Word
Cloud.
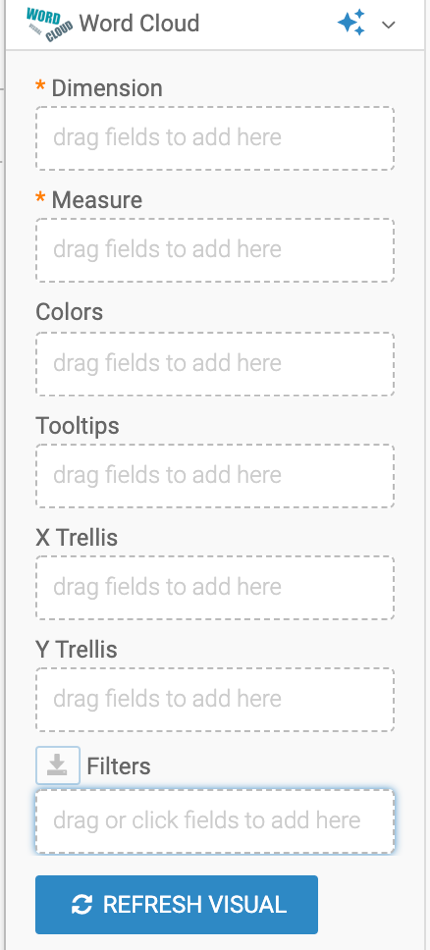
The shelves of the visual changed. They are now Dimension,
Measure, Colors,
Tooltips, X Trellis, Y
Trellis, and Filters. The mandatory shelves are
Dimension and Measure.
Populate the shelves from the available fields:
Add the field Text to the Dimension
shelf.
Add the field Record Count to the Measure
shelf.
Click REFRESH VISUAL.
Click the pencil/edit icon next to the title of the
visualization to enter a name for the visual.
In this example, the title is changed to 'Shakespeare Sonnets - Word Cloud'. You can
also add a brief description of the visual as a subtitle below the title of the
visualization.
At the top left corner of the Dashboard Designer, click
SAVE.
The visual should look something like this:
To adjust how the Word Cloud is displayed, check all the available settings for this visual.
It is interesting to compare different texts by examining their different word clouds. For more
information, see Trellised word clouds.