Trellised word clouds

CDP Data Visualization enables you to create trellised Word Cloud visuals.

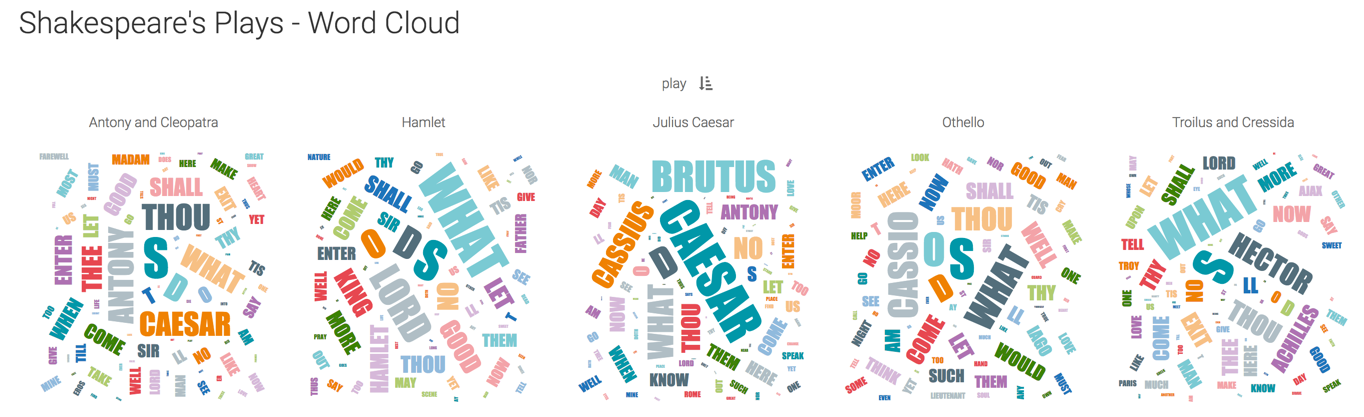
In the following example, you can compare text profiles using word cloud visuals, by considering the text of the collected plays of William Shakespeare.

The Shakespeare's Plays dataset is used, which was created from the shakespeare_play_text.csv datafile.

  1. In the VISUALS menu, find and click Word Cloud.
    For instructions, see Creating datasets and Creating a visual.
  2. Populate the shelves from the available fields:
    1. Add the field Text to the Dimension shelf.
    2. Add the field Record Count to the Measure shelf.
    3. Add the field Play to the X Trellis shelf to trellis the visual.
    4. Add the field Play to the Filters shelf, and select some of the plays. In this example the visual is filtered on Anthony and Cleopatra, Hamlet, Julius Caesar, Othello, and Troilus and Cressida.
  3. Optional: Remove the trellis borders, as described in Displaying trellis borders.
  4. Click REFRESH VISUAL.
  5. Click SAVE.

You can see that the Word Cloud visuals for these plays feature the names of leading characters prominently.