Displaying bubbles on maps
Cloudera Data Visualization enables you to display measurements over maps as bubbles. This task applies to Maps.
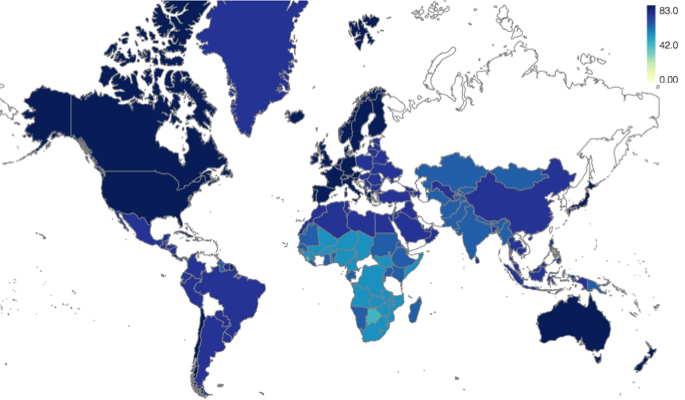
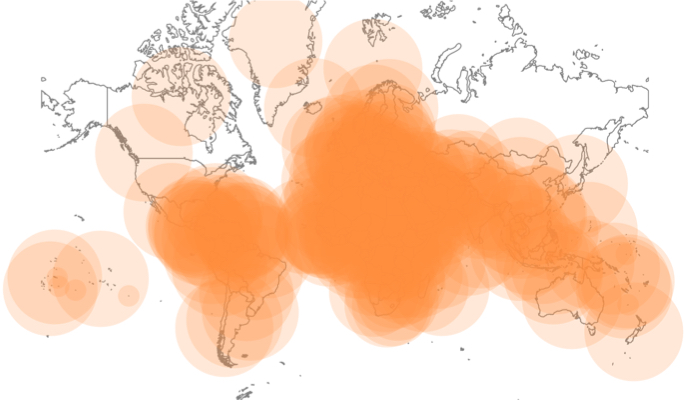
Many map visuals render as choropleths by default. To display measurements over maps as bubbles, click the Settings menu, select the Marks sub-menu, and select the Always display marks as bubbles option.

Compare the appearance of world map as a choropleth map, and as a map with bubble marks.
To adjust the size of the bubbles, see Change mark size range.