Filtering on an element
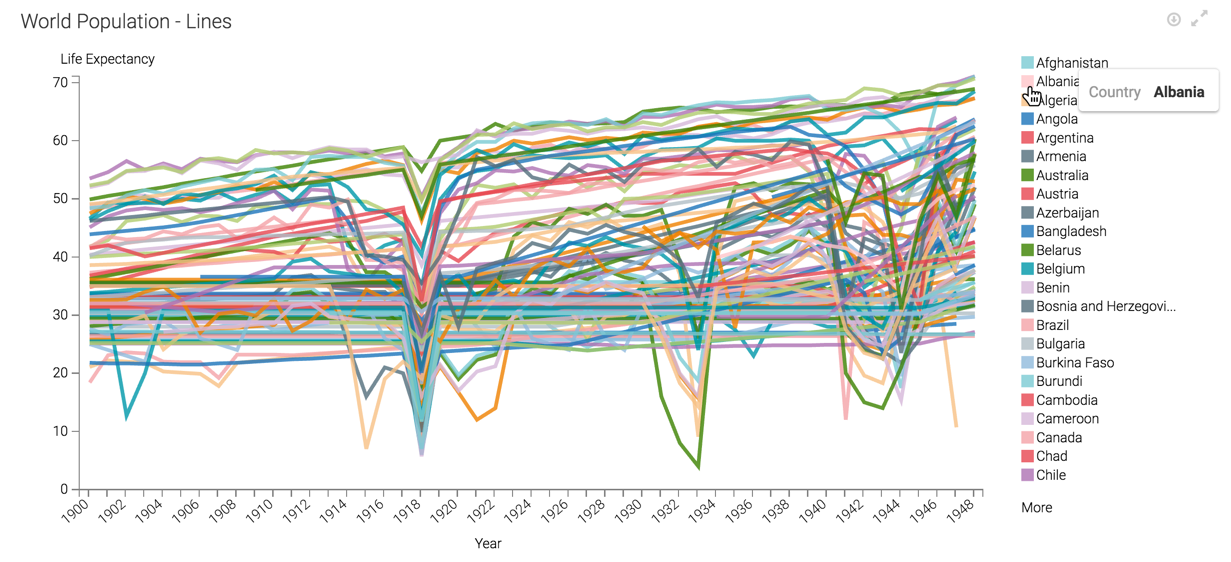
A line chart display can become very crowded, making it difficult to discern which line models a particular series. For example, the World Life Expectancy dataset models data for over 200 countries. In View mode, you can click on a particular element of a legend, and filter data for just that element.
-
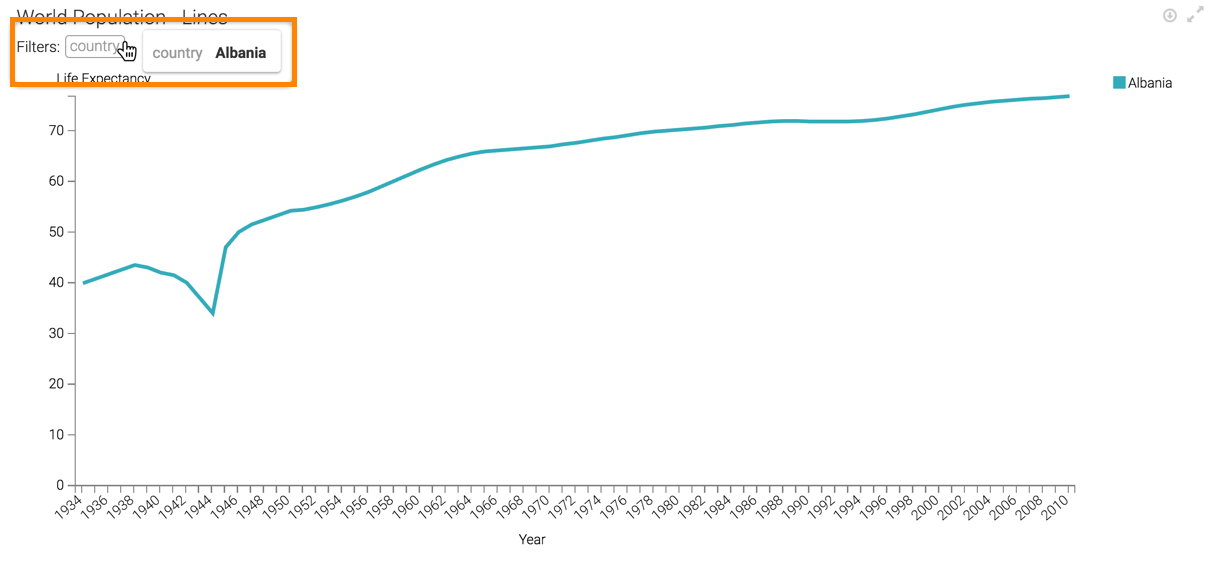
Click one of the options in the legend for the visual, to see only the data
for that country.
In this example, Albania is shown.
The new chart displays the line for Albania only. Additionally, the horizontal axis adjusts for the dimension range. Albania reports data starting in year 1934.
Cloudera Data Visualization lists all applicable filters at the top of the vertical axis. Hovering over them shows the values of the filters.