Creating a dashboard
You can easily create new dashboards in Cloudera Data Visualization.
-
There are several possible starting points for creating a new dashboard:
- Click NEW DASHBOARD in the top right corner of the main HOME interface.
- Click in the top right corner of the preview area in the VISUALS interface.
- Click the
 icon next to the name of a particular dataset on the
DATA interface.
icon next to the name of a particular dataset on the
DATA interface. - Click NEW DASHBOARD in the top right corner of the Dataset Detail view for a particular dataset.
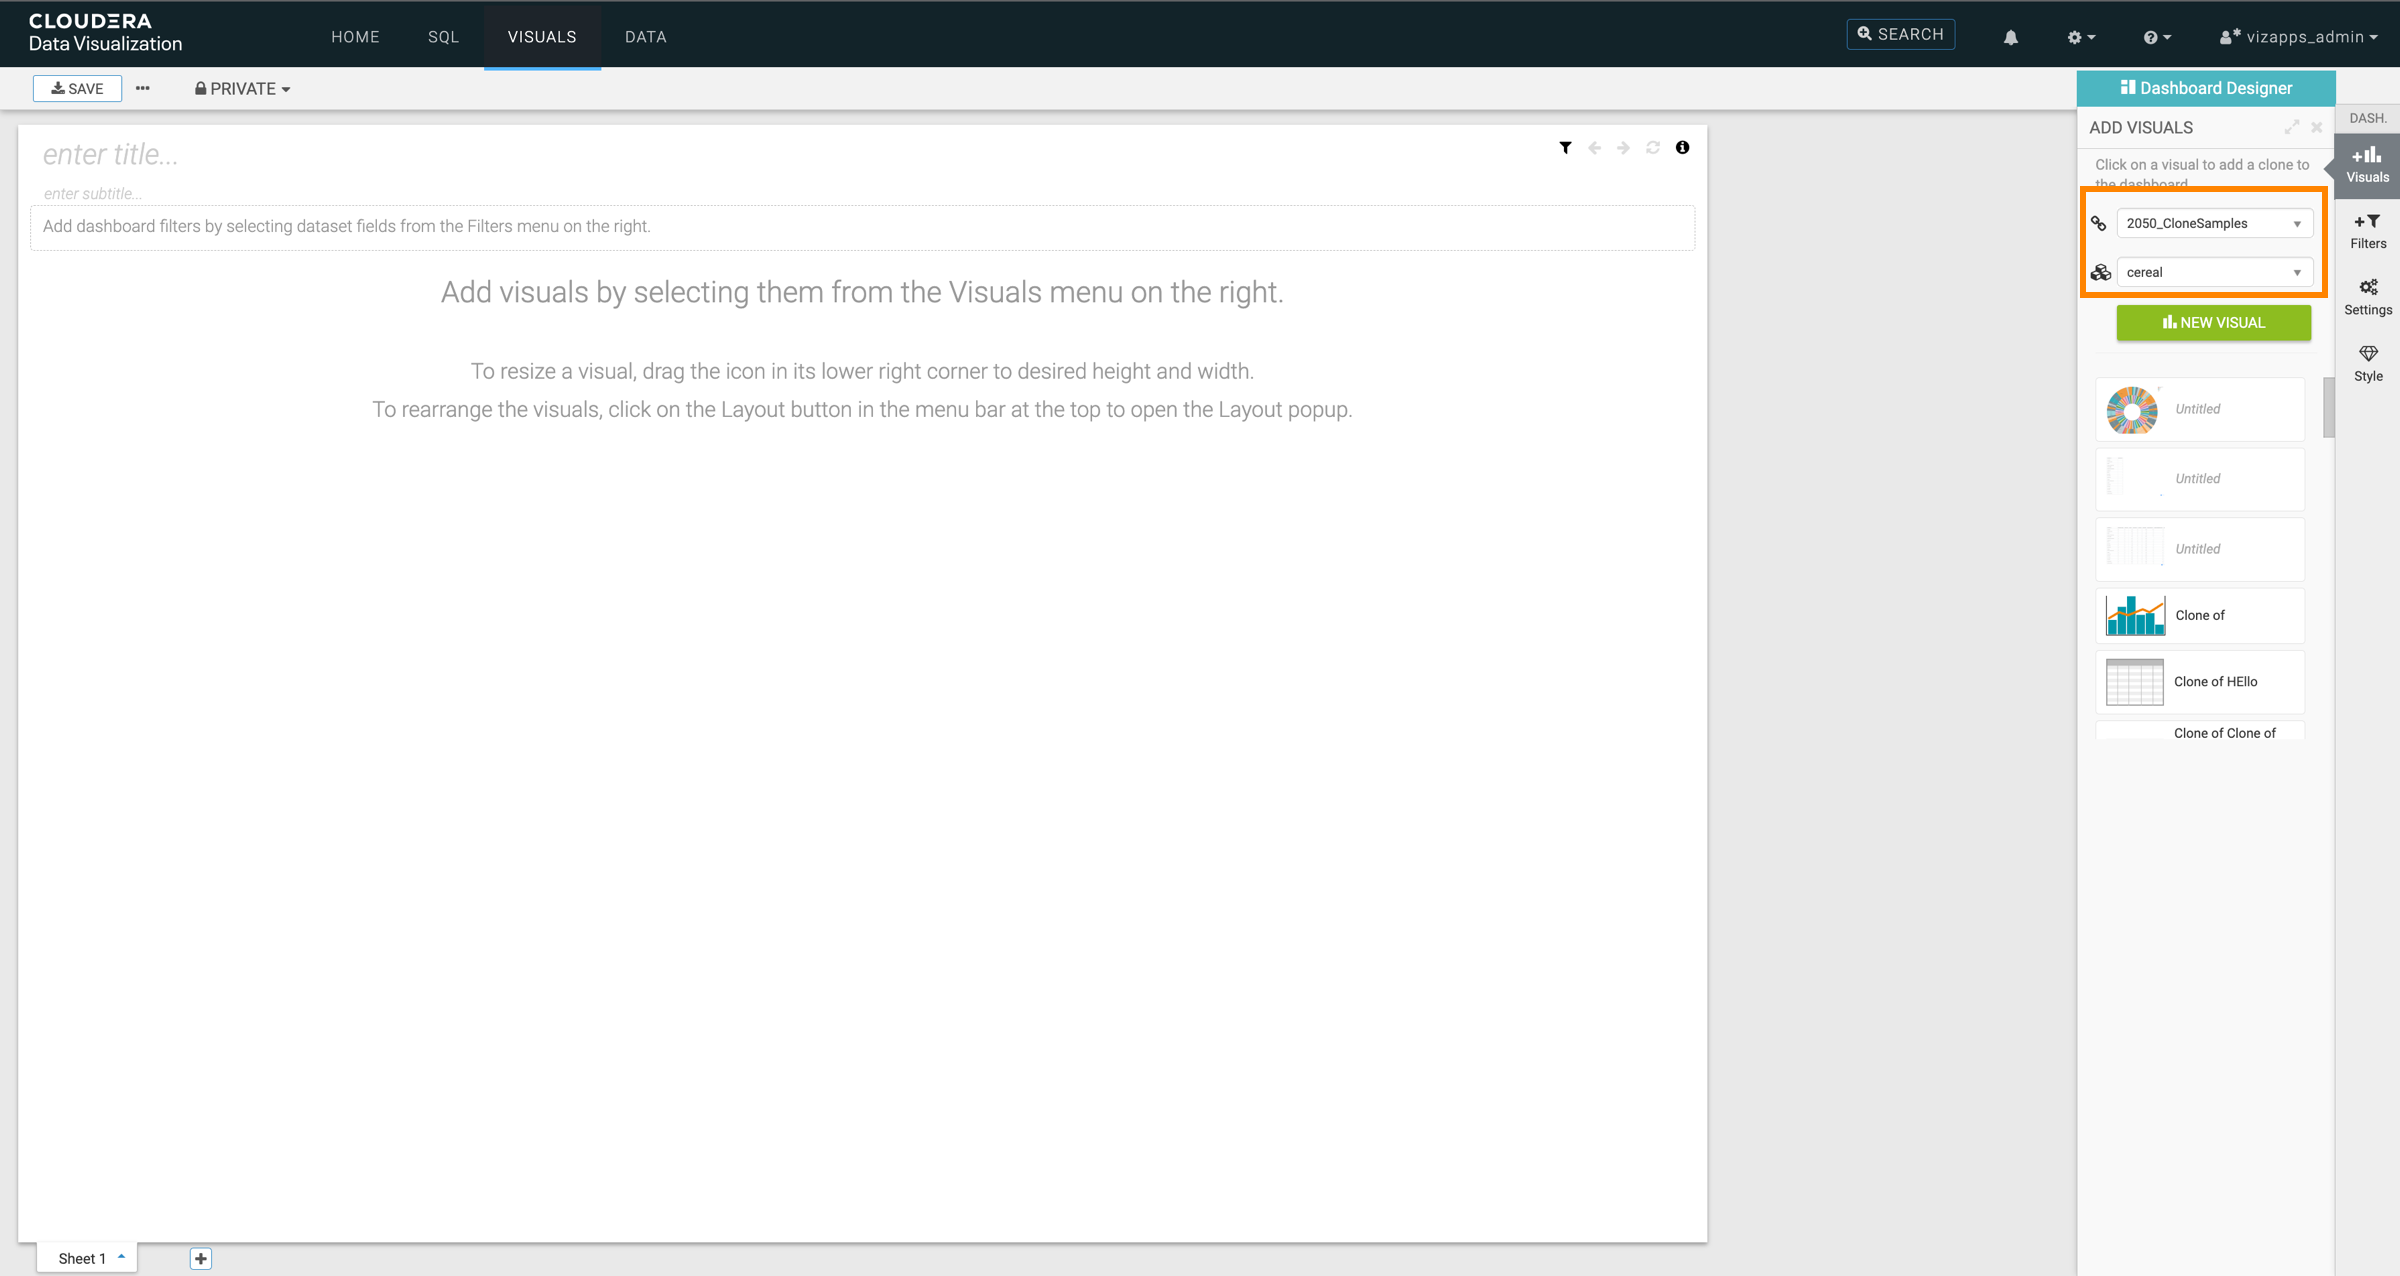
The Dashboard Designer opens and displays an untitled dashboard. See the Dashboard Designer documentation to familiarize yourself with the interface.
- Optional:
Change the connection and/or dataset.
The dashboard is automatically connected to the parent connection and dataset, but you can add visuals and filters based on other connections and datasets.
-
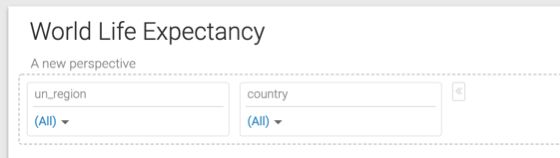
Add a title for the dashboard.
Optionally, you can also add a subtitle.
In this example, World Life Expectancy and A new perspective are used as title and subtitle.