Normalizing the histogram
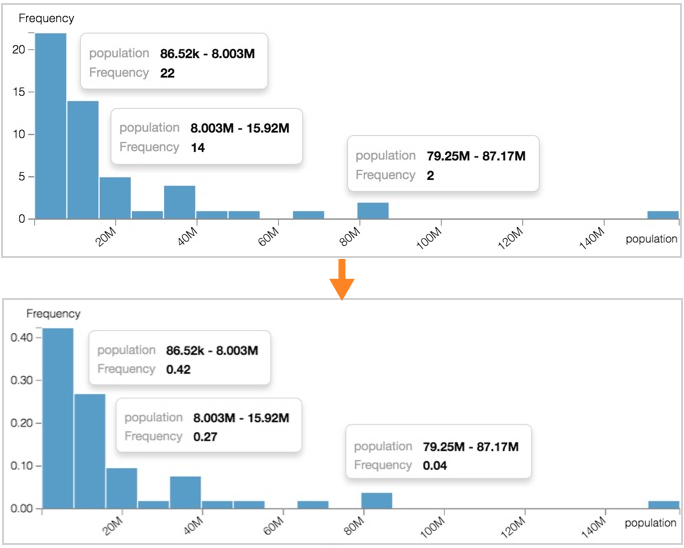
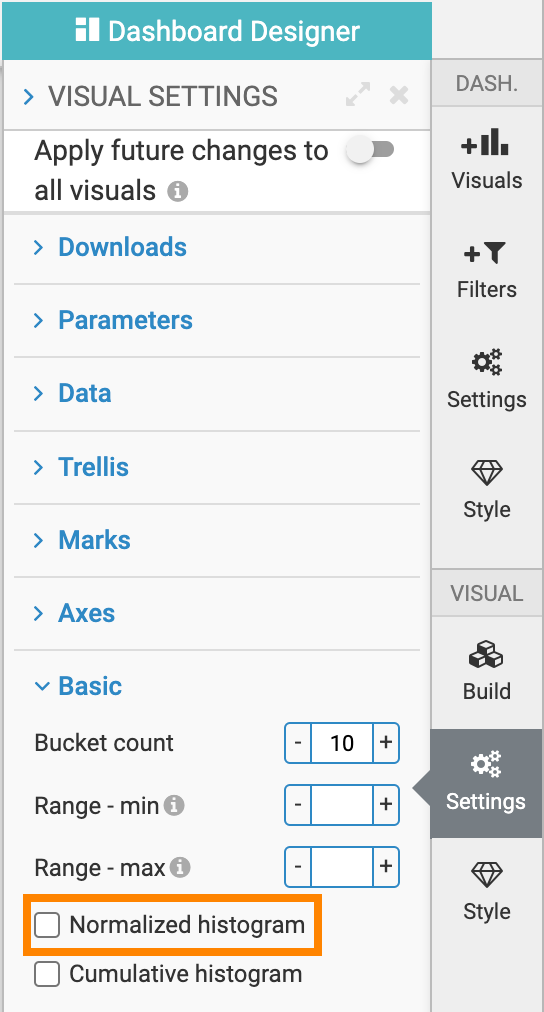
By default, the vertical axis of a histogram represents the count of values that map to a particular bucket. To represent these values as percentages of the total, you can normalize the histogram. This adjustment changes the histogram counts so they sum to 1, with each bar representing the proportionate frequency.
The following image compares two versions of a histogram. In the standard histogram (top), the vertical axis and tooltips display raw counts. In the normalized histogram (bottom), the vertical axis and tooltips show values as percentages, indicating the relative frequency of each bucket.


