SQL queries
In Cloudera Data Visualization, SQL query visuals enable you to process SQL language queries using an enhanced visual editor for SQL authoring, including autocomplete.
-
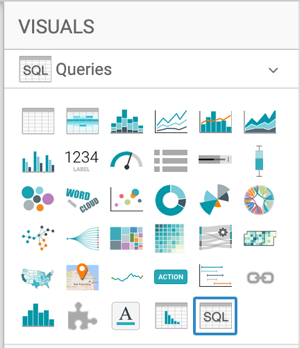
Select SQL Queries in the VISUALS
menu.
The shelves of the visual changed. You can find a link in the shelf area that leads you to the visual in full-screen mode, where you can view/edit the SQL statement in the SQL editor.
-
Enter the following text in the Enter/Edit SQL Expression modal
window:
SELECT
    TA_0.`stname` as `State`,
    TA_0.`ctyname` as `County`,
    (sum((TA_0.`wa_male`))+sum((TA_0.`wa_female`))) as `White`,
    (sum((TA_0.`ba_male`))+sum((TA_0.`ba_female`))) as `Black or African American`,
    (sum((TA_0.`ia_male`))+sum((TA_0.`ia_female`))) as `American Indian and Alaska Native`,
    (sum((TA_0.`aa_male`))+sum((TA_0.`aa_female`))) as `Asian`,
    (sum((TA_0.`na_male`))+sum((TA_0.`na_female`))) as `Native Hawaiian and Other Pacific Islander`,
    (sum((TA_0.`tom_male`))+sum((TA_0.`tom_female`))) as `Two or More Races`,
    sum((TA_0.`tot_pop`)) as `Total Population`
  FROM `samples`.`us_counties` TA_0
  GROUP BY 1, 2
  LIMIT 5000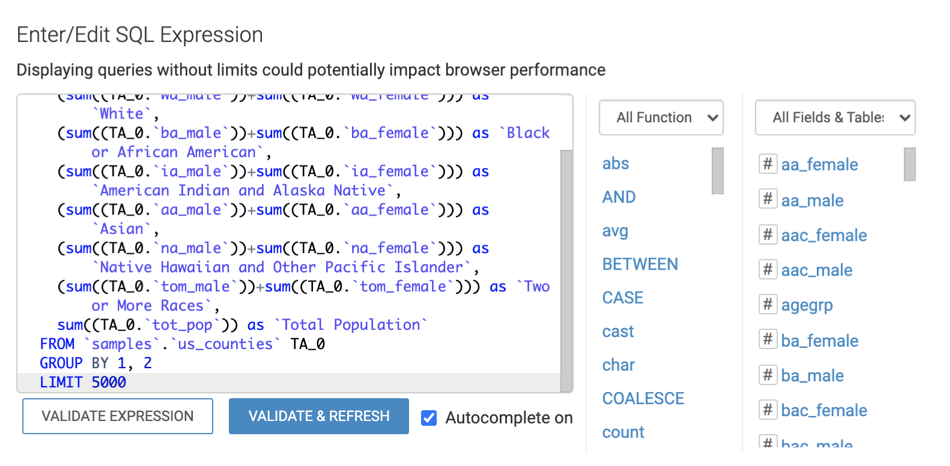
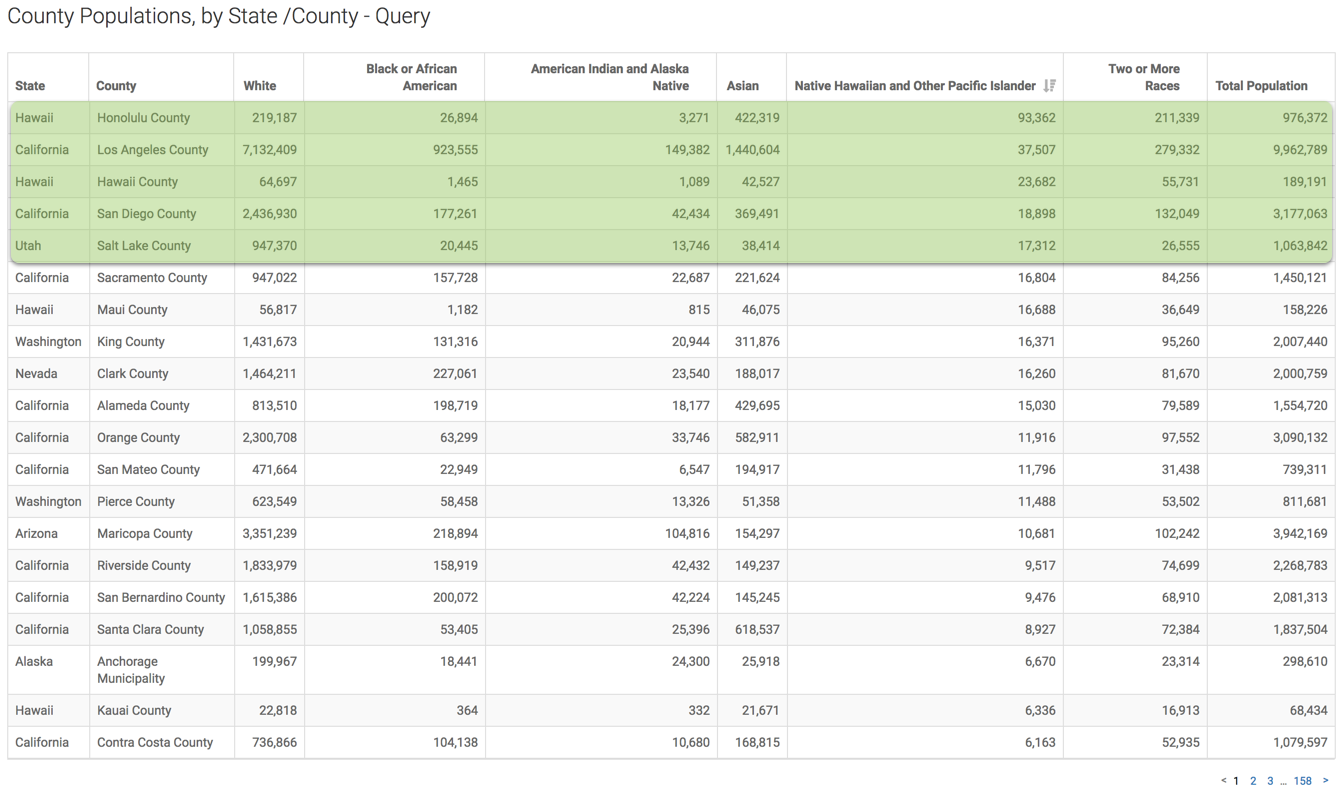
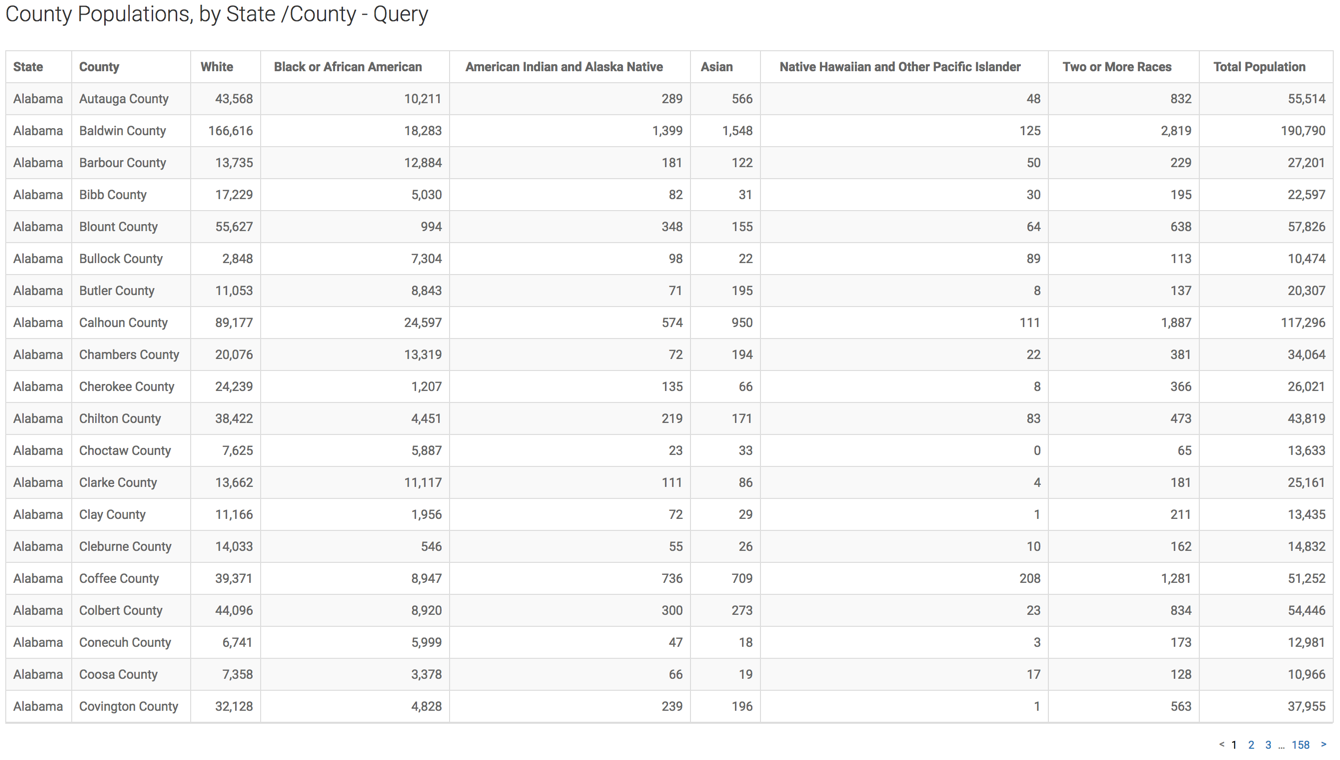
The table created from the query should look similar to this:
As an example of using this visual, sort on the column Native Hawaiian and Pacific Islander to see where most people of that ethnicity live. You can notice that there is a very large population in Los Angeles, San Diego, and in the Salt Lake area.