Cloudera Data Visualization enables you to create Rich Text
visuals.
You can use markup code to add supporting textual or visual information to your
dashboard. You can insert styled paragraphs, hyperlinks, tables, images, and other
elements. These insterted elements do not use any information from the dataset.
The following steps demonstrate how to create a visual with rich text formatting.
Start a new visual based on the World Life Expectancy dataset.
For instructions, see Creating a visual.
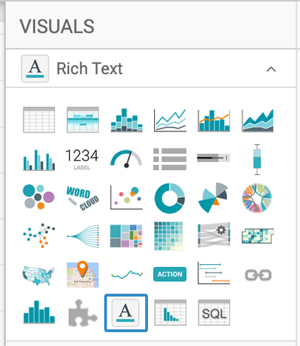
Select Rich Text in the VISUALS
menu.
The shelves of the have visual changed. This visual type does not have any
shelves associated with it. Instead, it has a single text box for entering and
editing text or markup.
Click the (expand) icon to open the Rich Text
Editor.
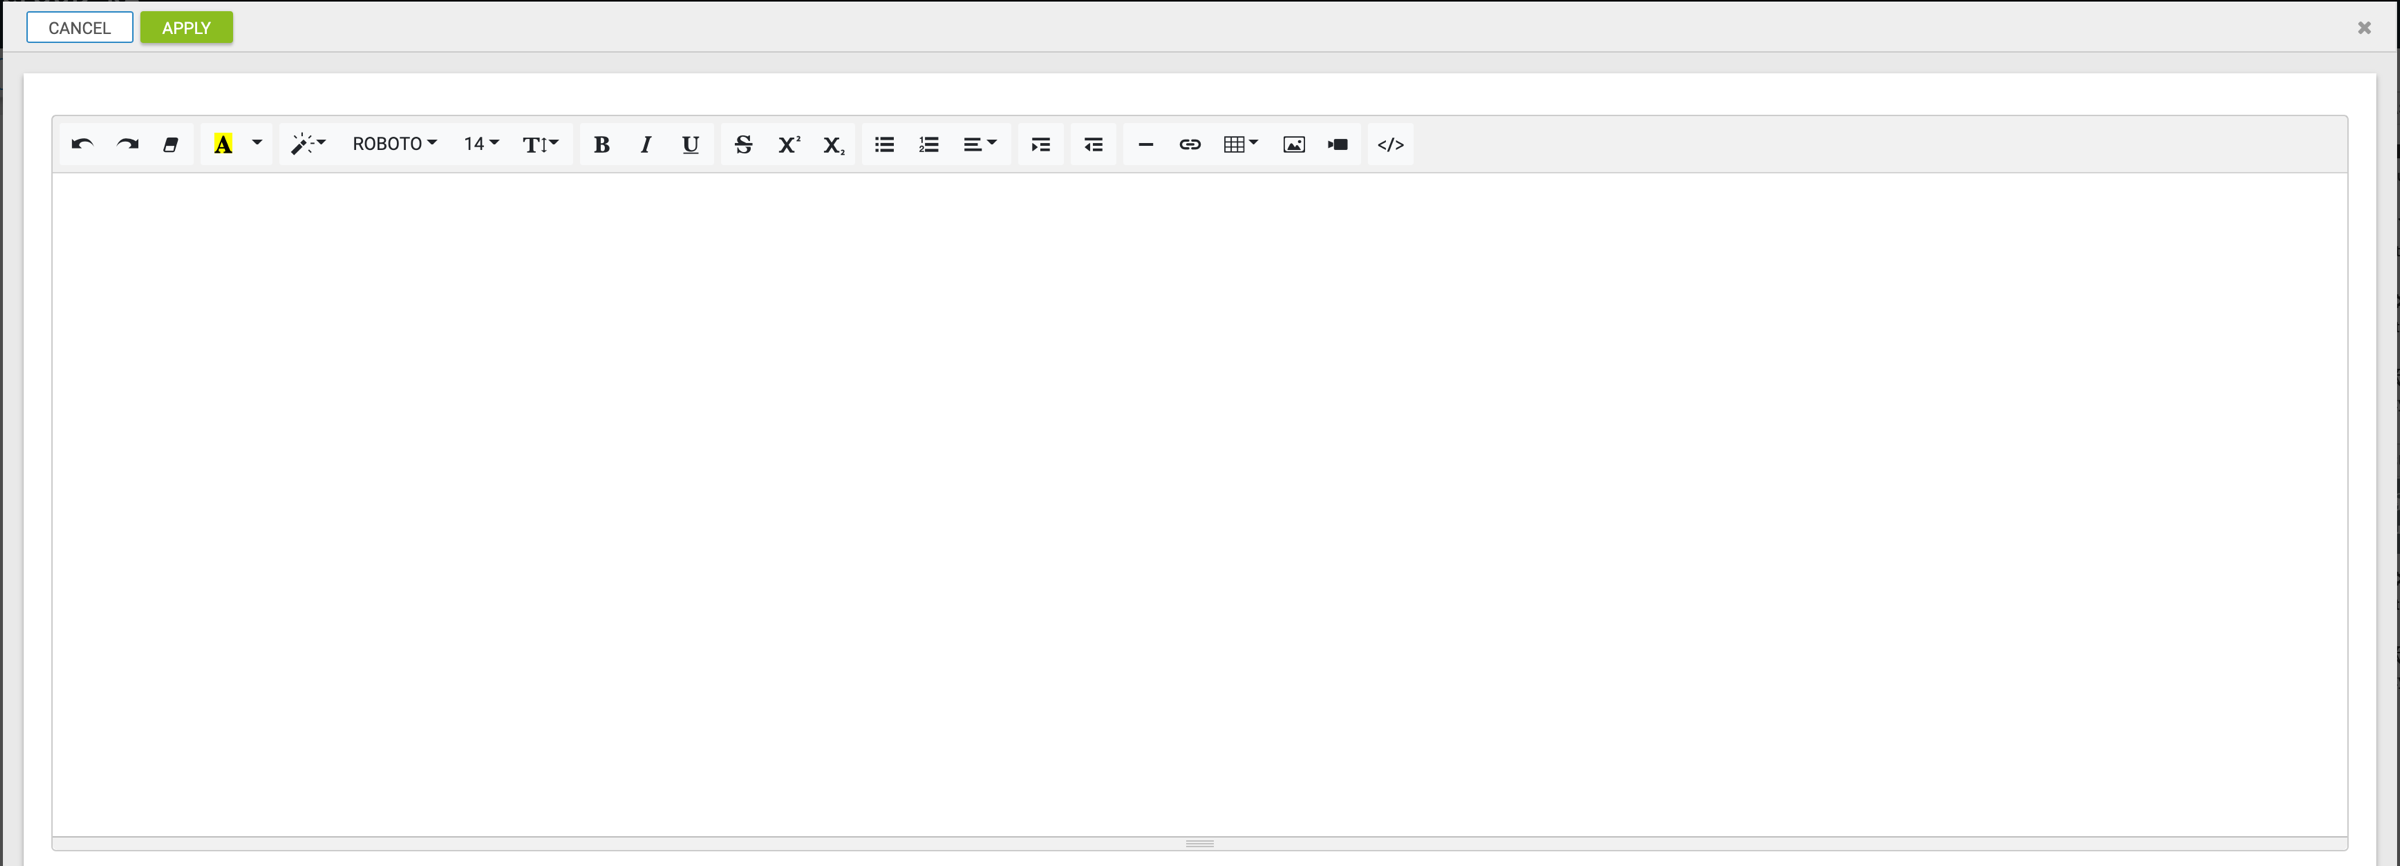
The editor modal window contains a large text box and an editing tool
bar.
Paste the following text in the text box.
In the early 1800's, life expectancy at birth began to increase significantly in the countries that industrialized early, but it remained low in the rest of the world. Industrialization levels correlated strongly with life expectancy, and lead to notable inequalities in global health distribution. Good health was prevalent in the rich countries, where improvements in sanitation, infant/maternal care, and food quantity lead to longer life. Meanwhile, poor health persisted in poorer countries.

This global inequality decreased over the last half of the 20th century. Countries that relatively recently suffered from bad health are catching up rapidly. Since 1900, the global average life expectancy more than doubled, increasing from 32.6 years for all reporting countries to 70.0 years.
Optional: You can format the text that you have added to the visual. Enhance the basic
text according to your requirements.
Formatting controls include the following options (from left to right on
the editing toolbar):
Undo and Redo
Remove Font Style
Recent Color and More
Color selector for Background Color and
Text Color
Style selector for Normal,
Blockquote, Code, Header 1 - Header
6, Font Family menu,
Font Size menu, and Line
Height menu
Character formatting: Bold,
Italic,
Underline,
Strikethrough,
Superscript, and
Subscript
Paragraph formatting: Unordered list,
Ordered list, and
Paragraph alignment: left,
center, right, justified,
outdent, and indent
Indentation options: Indent and
Outdent
Embedding controls include the following options:
Horizontal Rule
Link
Table
Picture
Video
Optional: You can also edit your visual in Code view.
Rich text visuals support the Code View option, as a
simple toggle between Text view and Code view.
For example, you can override the width settings on a previously inserted
image. Editing in Code view enables you to specify the width in terms
of
percentages:
You can also remove table borders or format custom email notification
templates.
Click APPLY to save your changes and return to the
dashboard.
If you do not want to apply your changes, click CANCEL
or just close the modal window.
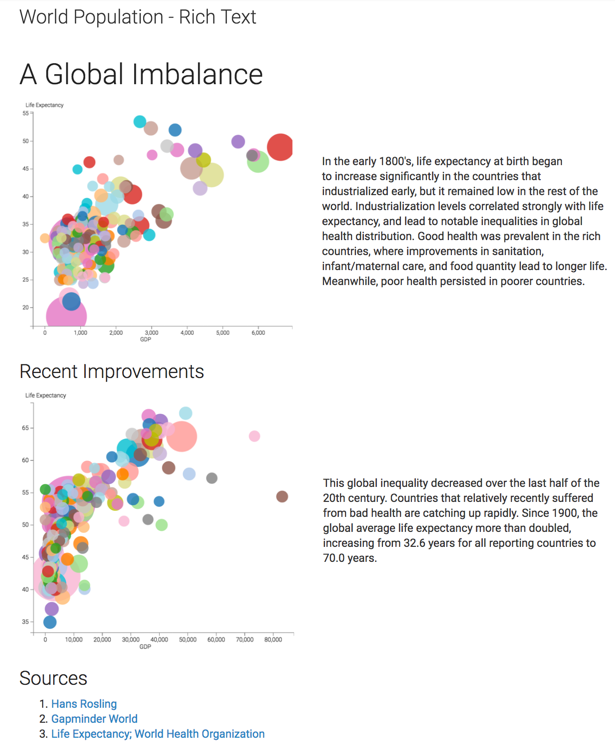
Change the title to World Population - Rich Text.
[Optional] You can also add a brief description of the visual as a subtitle
below the title of the visualization.
Click SAVE at the top left corner of the
Dashboard Designer.
In this example, the following changes have been implemented: two tables with images
in the left column and text in the right column, 2 levels of headings, and links for
sources. Your visual should look something like this:
We want your opinion
How can we improve this page?
What kind of feedback do you have?
This site uses cookies and related technologies, as described in our privacy policy, for purposes that may include site operation, analytics, enhanced user experience, or advertising. You may choose to consent to our use of these technologies, or