Networks: same source and target data values

Network visuals can show the same node once, or several times on the same chart, depending on node settings.

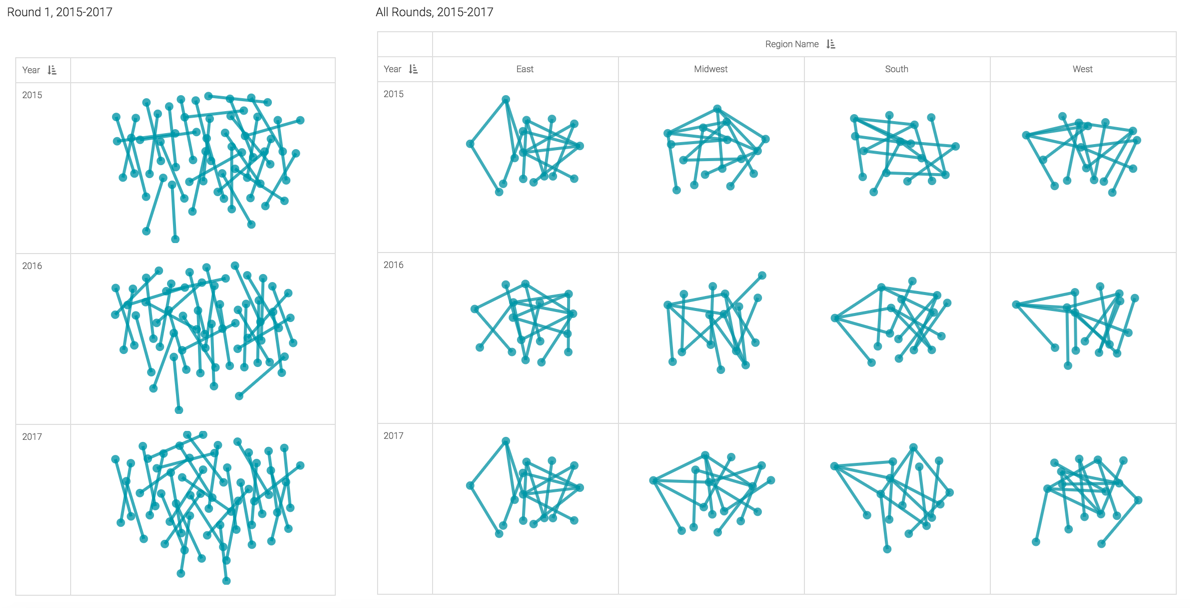
In the following example the NCAA Basketball dataset is used, and the visual is based on a visual developed in Networks. The original visual shows only Round 1 play, or 1:1 match-ups.

  1. Clone the visual, and save it as All Rounds, 2015-2018.
    For instructions, see Cloning a visual.
  2. Add Region Name to the X Trellis shelf.
    This shows all regions separately, and makes it easier to pick out the nodes that have multiple links.
  3. Because this dataset defines the 'Final 4' and 'Championship' play as regions, add Region Name to the Filters shelf, and exclude these values.
  4. To choose all rounds of play, remove the Round field from the Filters shelf.
  5. Click Settings > Nodes and select Source & target node data come from the same base values.
    For more information, see Showing the same source and target values.
  6. Click REFRESH VISUAL.
    You can see the difference between the two visuals: the one showing all rounds is much denser, and shows multi-branching from some of the same nodes.