Create a visual
Learn how you can create a visual in Cloudera Data Visualization.
- On the main navigation bar, click VISUALS.
-
Click NEW DASHBOARD to open a new dashboard in Edit
mode.

Alternatively, click an existing dashboard, and then click Edit to make changes to it.
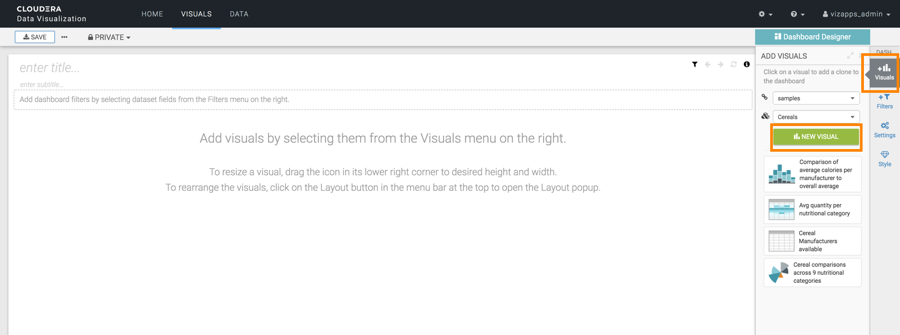
- In the Dashboard Designer menu, click the Visuals icon to open the ADD VISUALS interface.
- Click NEW VISUAL.

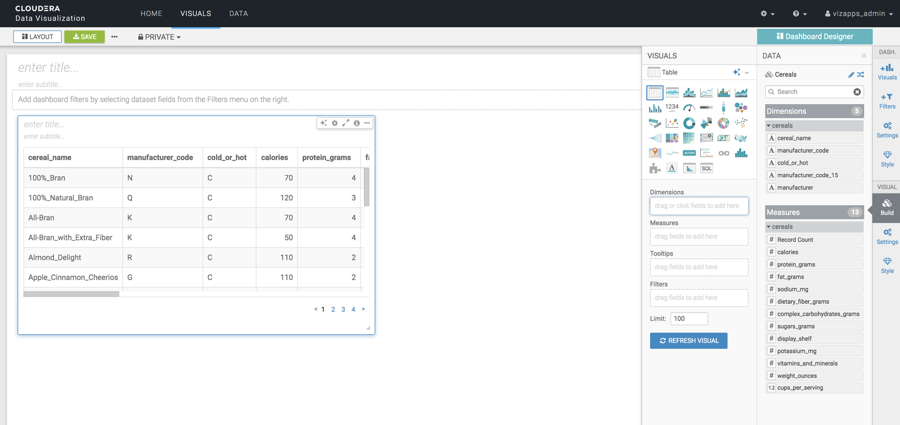
The visual designer interface opens with a default table representation of the dataset you want to visualize.

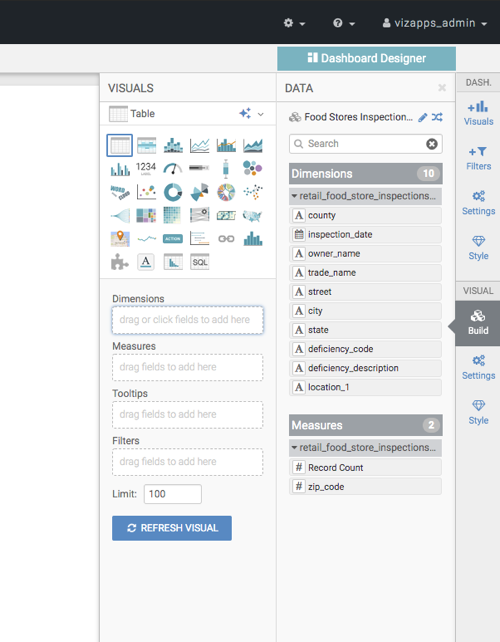
- Choose a visual type from the VISUALS catalog, which shows
the standard visual types. You can switch between visual types by selecting a different
type in the catalog.
- Populate the shelves from the available Dimensions and
Measure fields.
The shelves of a visual specify the fields and segments that provide the data for visualization. Different visual types require specific information, and have somewhat different shelves.

- Click REFRESH VISUAL.
- Add a title for the visual by clicking into the enter title... field to edit it.
- [Optional] Add a brief description of the visual by clicking into the enter subtitle... field under the title of the visual.
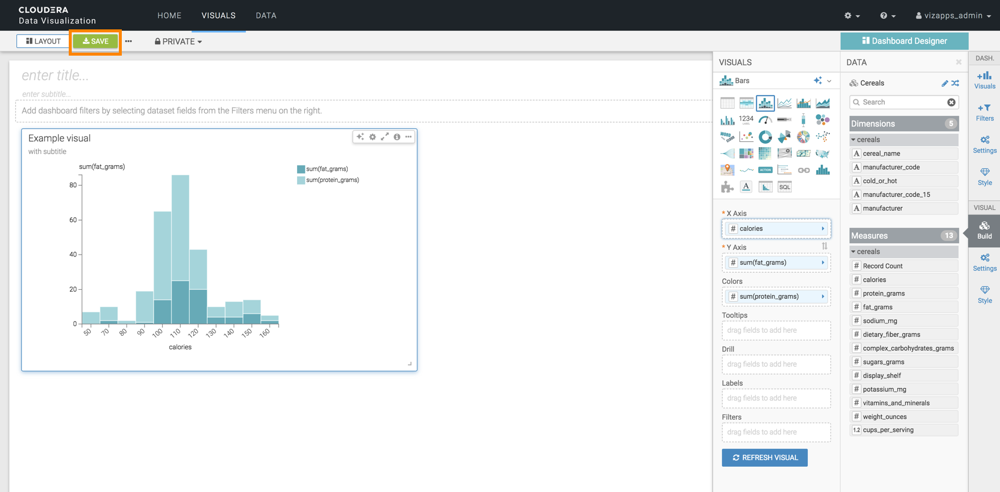
- At the top left corner of the visual designer, click
SAVE.


