Customizing output parameters
In Cloudera Data Visualization, application controls can use custom output parameters. You can use custom output parameters for application controls. This allows you to apply a filter from one dataset to control the visual presentation of another dataset.
Often, the field names between the source (driver) and target datasets do not match. You can resolve this by mapping the filter’s value to the correct field in the target dataset.
The following steps show you how to configure a filter based on the US State Populations Over Time dataset to control a visual based on the US County Population dataset.
-
Hover over the added filter until controls appear in the top right corner, then click
 .
.
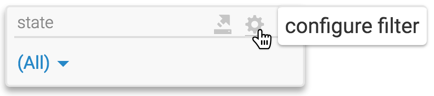
The Settings modal window opens on the Values tab.
-
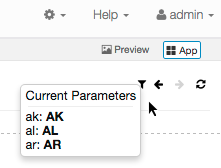
In the top right corner of the application, hover over
 to
review the current filter parameters.
to
review the current filter parameters.
This reports the current filtering parameters. The output parameter is correctly named stname, and the filtering conditions applied earlier are displayed.
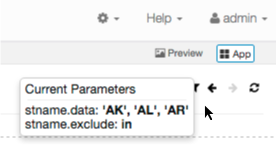
If the Emit distinct parameters for each item selected option is selected on the Display Settings tab, the filter reports each selection as distinct key/value pairs. By default, the label for each key is derived from its value. However, if labels are specified (for example, when using optional parameters), they will be displayed instead.