Displaying tooltips
For certain visuals like sparklines, adding tooltips to your visual provides access to additional options to show values in the tooltip. You can customize your tooltip settings by the selecting specific options as needed.
To turn tooltips on, navigate to and select the Display Tooltips option.
Enabling minimum value in tooltips
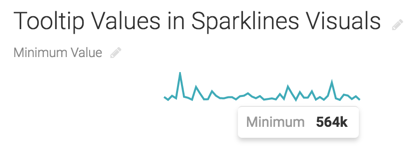
You can enhance your certain visuals (for example Sparklines) by displaying the minimum value in tooltips.

Once enabled, the minimum value will be included in the tooltip when hovering over your visual.

Enabling maximum value in tooltips
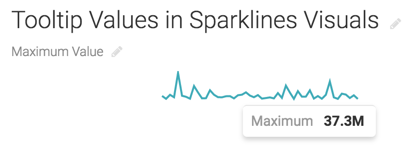
You can enhance your certain visuals (for example Sparklines) by displaying the maximum value in tooltips.

Once enabled, the maximum value will be included in the tooltip when hovering over your visual.

Enabling first value in tooltips
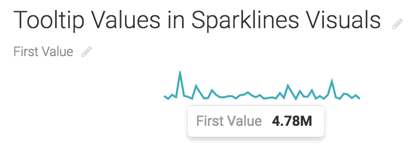
You can enhance your certain visuals (for example Sparklines) by displaying the first value in tooltips.
To display the first value in a tooltip, navigate to , select Display Tooltips, and then select Enable first value in tooltips.

Once enabled, the first value will be displayed in the tooltip when hovering over your visual.

Enabling last value in tooltips
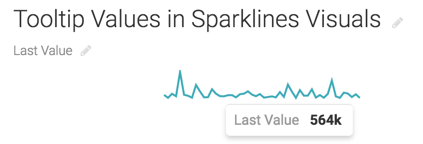
You can enhance your certain visuals (for example Sparklines) by displaying the last value in tooltips.
To display the first value in a tooltip, navigate to , select Display Tooltips, and then select the Enable last value in tooltips option.

Once enabled, the last value will be displayed in the tooltip when hovering over your visual.


