Displaying legend in choropleth map
In an Interactive Map visual, Cloudera Data Visualization enables you to display a legend in a choropleth map.
- In the Settings menu, click
Choropleth.
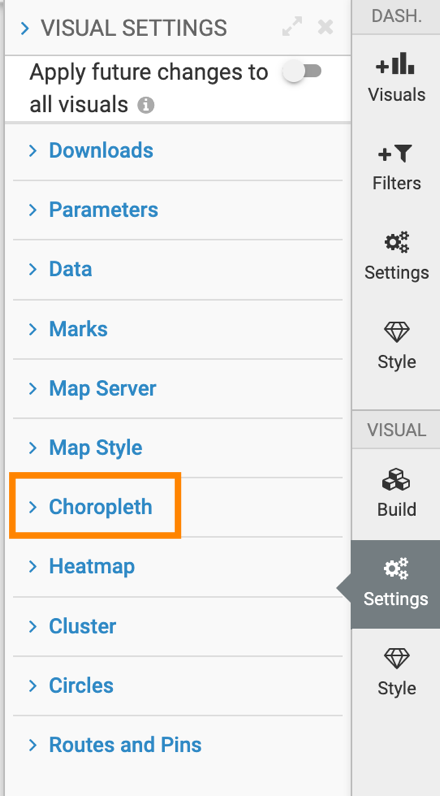
- To display a legend, select the Include legend option.

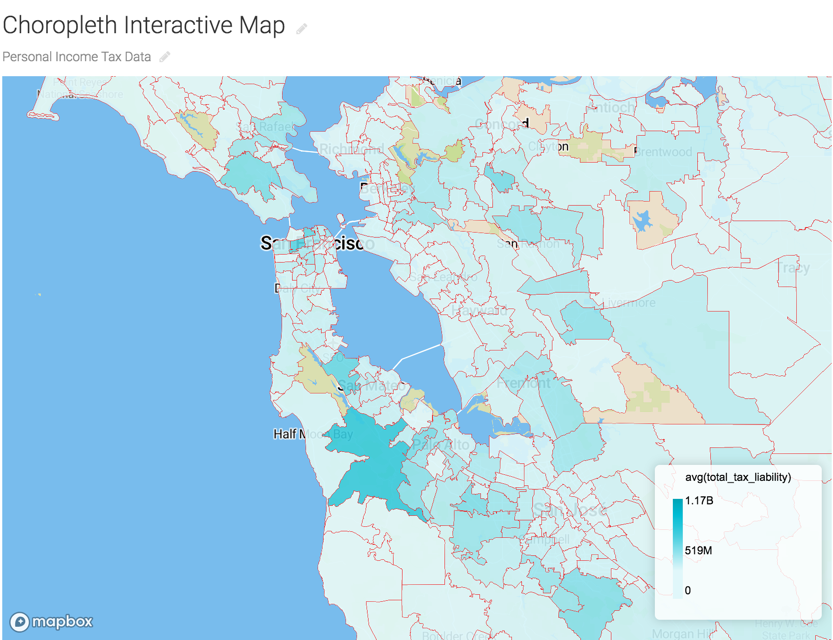
In the following image, notice the legend at the bottom right corner, with gradient of colors showing the average tax liability in California by zip code.