Filtering data using legends

With large datasets, a visual may become very crowded, making it hard to understand what graphical elements represent. In Cloudera Data Visualization, you can easily filter on a particular element in the legend.

Cloudera Data Visualization legends are interactive. In View mode, you can easily find an element, by either hovering over an element, or by clicking to filter on a particular element.

In dashboard Edit mode, you can filter on a particular element in the legend. You can also test the behavior of the filter before viewing the filter results in View mode.

The following procedure shows you how to filter a visual from a legend.

  1. Open an existing dashboard in Edit mode.

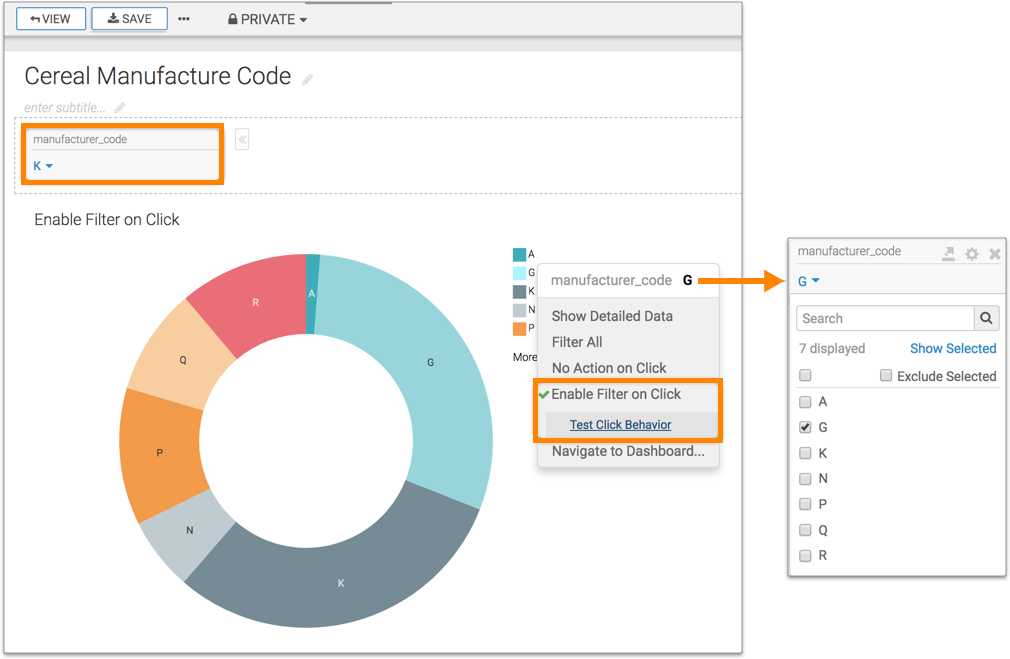
    In this example, the Cereal Manufacture Code dashboard with the Enable Filter on Click visual is used.

  2. Make sure that the visual displays the legend.
  3. Switch to the Filters tab and create a custom filter in the filter area of the application.

    In the below example the manufacture code filter has been added. The manufacture code is currently filtering on the letter K.

  4. Hover over option G in the legend and right click to open a dropdown menu.

    Enable Filter on Click is selected by default.

  5. Click Test Click Behavior to verify if click behaviour is working on the filter.

    The manufacture code filter changes to letter G.

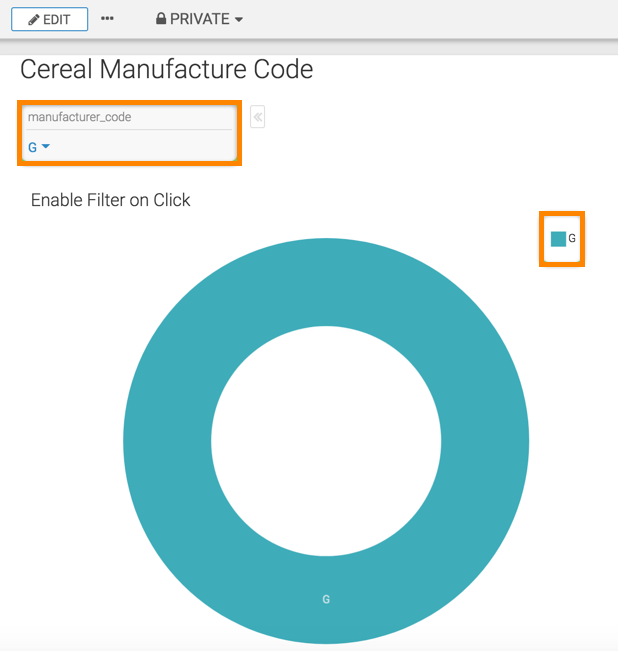
  6. Click VIEW to see Enable Filter on Click behavior on one of the legend options.

    The visual is now filtered on manufacture code G.