Using segments in visuals
This article demonstrates how segments work in a visual.
After creating segments in the Dataset Segments user interface, or creating segments from filter definitions of a visual, you can view this segmented data in a visual.
-
Click Data in the side navigation bar of the visual
interface.
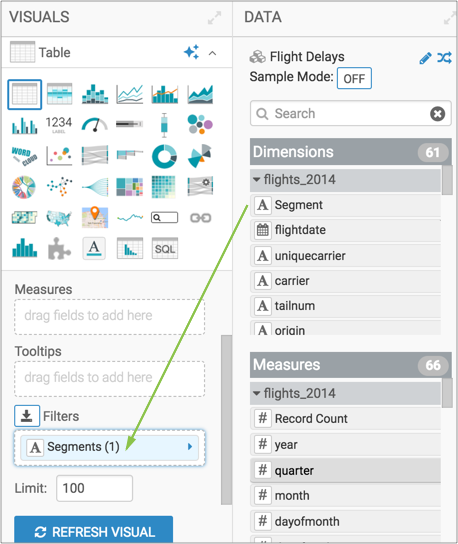
The segments (and the segment group) that you defined earlier appear in the Segments menu.
-
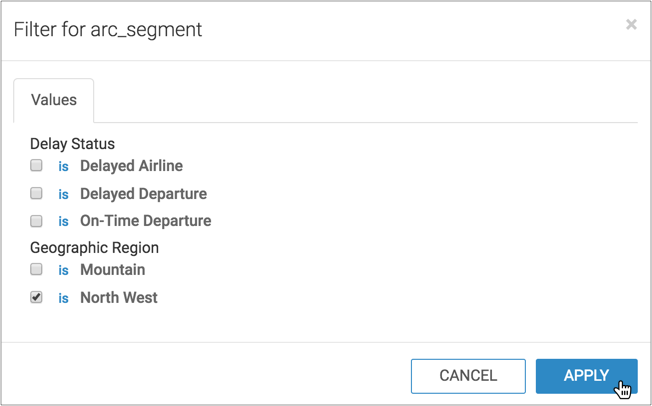
Select one of the segments, and click REFRESH VISUAL.
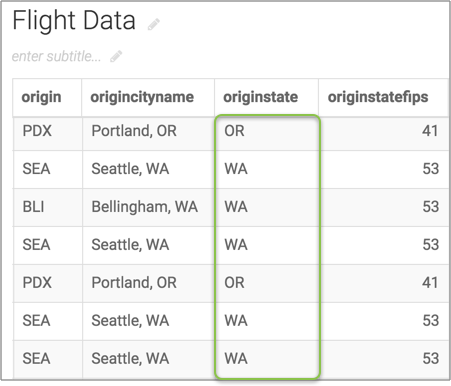
In this example, North West has been selected.
The visual only shows the rows that match the segment criteria. In this example, the states WA and OR.