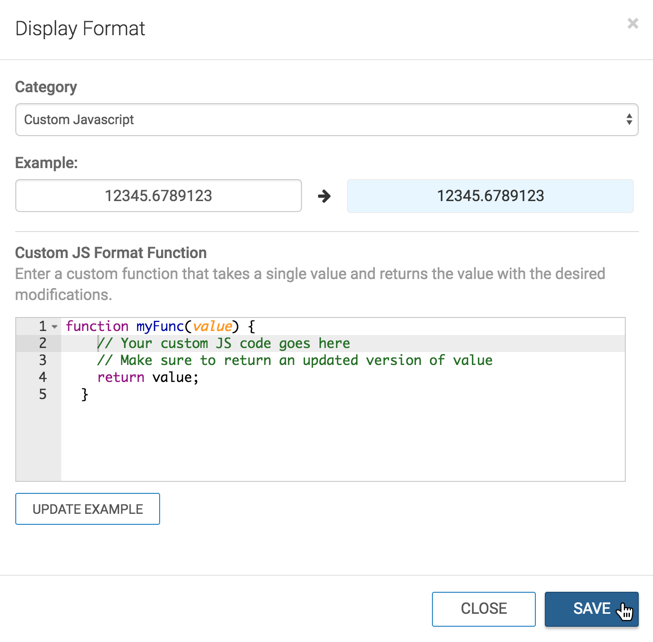
Customizing display format using Javascript

In Data Visualization, you can customize the display format of fields in visuals using Javascript. The Javascript editor includes auto-complete functionality, and checks for valid code.

This feature is available with the following conditions:

  • Site-wide setting for customization are turned on; see Enabling Custom Styling.
  • The user is either an Admin, or has Manage custom styles permissions.

In addition to other categories, Data Visualization has a Custom Javascript option that enables a wide range of custom display configurations.

The following steps outline how to use the Display Format: Custom Javascript interface.

  1. Click the field you plan to modify, to open the Field Properties menu.
  2. Under Field Properties, click Display Format.
  3. In the Display Format interface, select Custom Javascript from the Category menu.
  4. In the Customize JS Format Function code entry box, enter valid JavaScript code.
  5. Click Save.

Specifying text color based on a scalar threshold

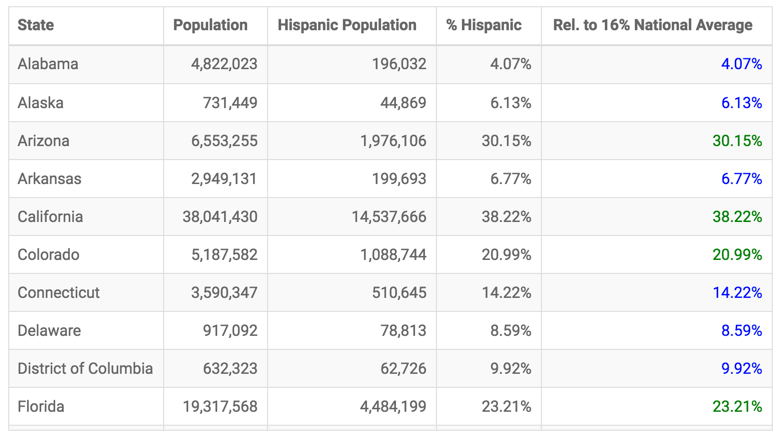
In the following example, we adapted the custom JS format to more clearly identify which US States have a Hispanic population over or under the national average of 16%.

function myFunc(value) {
    // change display color based on value 
    // being under or over national average of 16%
    // expressed as percentage, with two decimal places
    if (value < .16) {
        // less than 16% is blue
        return `<div style="color: blue">${Number(value * 100).toFixed(2)}%</div>`;
        } 
    else {
        // 16% or greater is green
        return `<div style="color: green">${Number(value * 100).toFixed(2)}%</div>`;
        }
  }

Compare the results in the % Hispanic column (uses percentage display and the Rel. to 16 National Average column, that uses custom Javascript code in this example.