
Importing a visual
In Cloudera Data Visualization, you can import linked visuals from another
system using an appropriate .json file that captures the definitions of these
visual artifacts and all their dependencies (such as datasets and custom styles).
Follow these steps to import a visual.
-
At the top of the screen, click the (ellipsis) icon for the
(supplemental) menu.
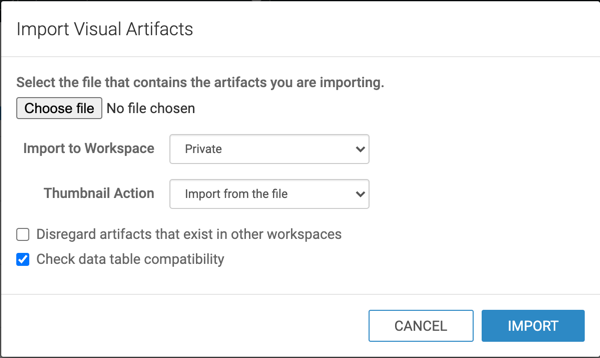
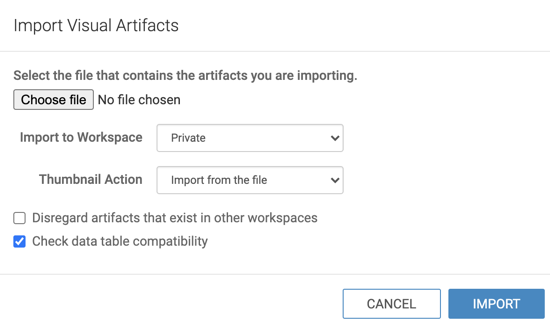
The Import Visual Artifacts modal window appears.
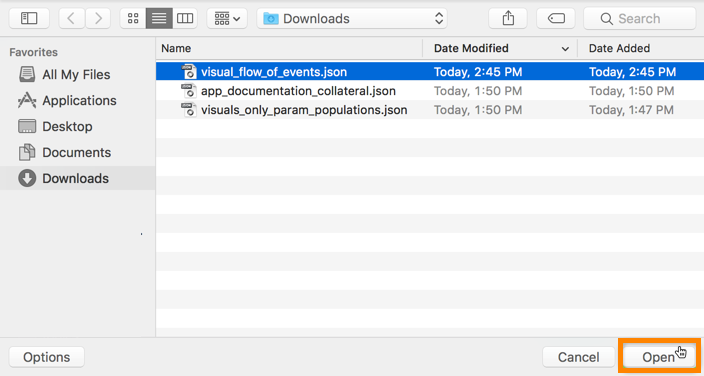
- Select the file you want to import.In this example, visuals_flow_of_events.json is selected.
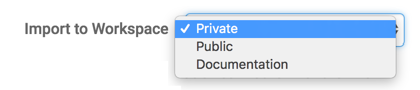
- Specify the destination workspace in the Import to Workspace
drop-down menu.By default, Cloudera Data Visualization imports the visual artifacts into your Private workspace. However, you can choose the Public workspace, or another workspace.
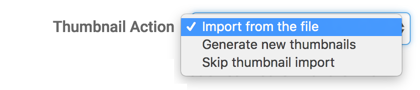
- Specify how you want to handle thumbnails.By default, Cloudera Data Visualization imports the thumbnails from the file. However, you can choose to generate new thumbnails during the import process, or skip thumbnail import.
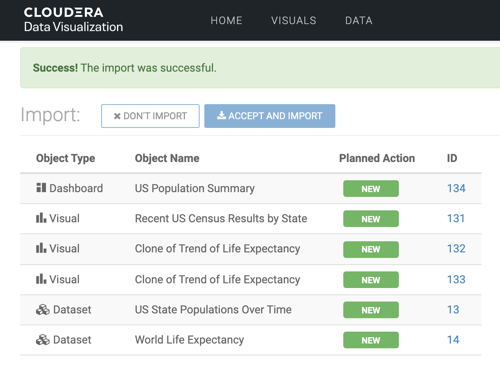
- Click IMPORT.
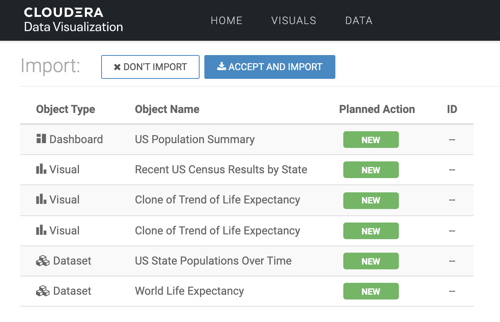
After processing the import
JSONfile, Cloudera Data Visualization opens the Import interface to show its visual artifacts.In this example, the Planned Action column shows that this is a new import for all artifacts. At this point, none of them have an assigned ID.
For instructions on how to export a visual, see Exporting a visual.
For more information about the visual artifact migration utility, see Exporting and importing visual artifacts.
