
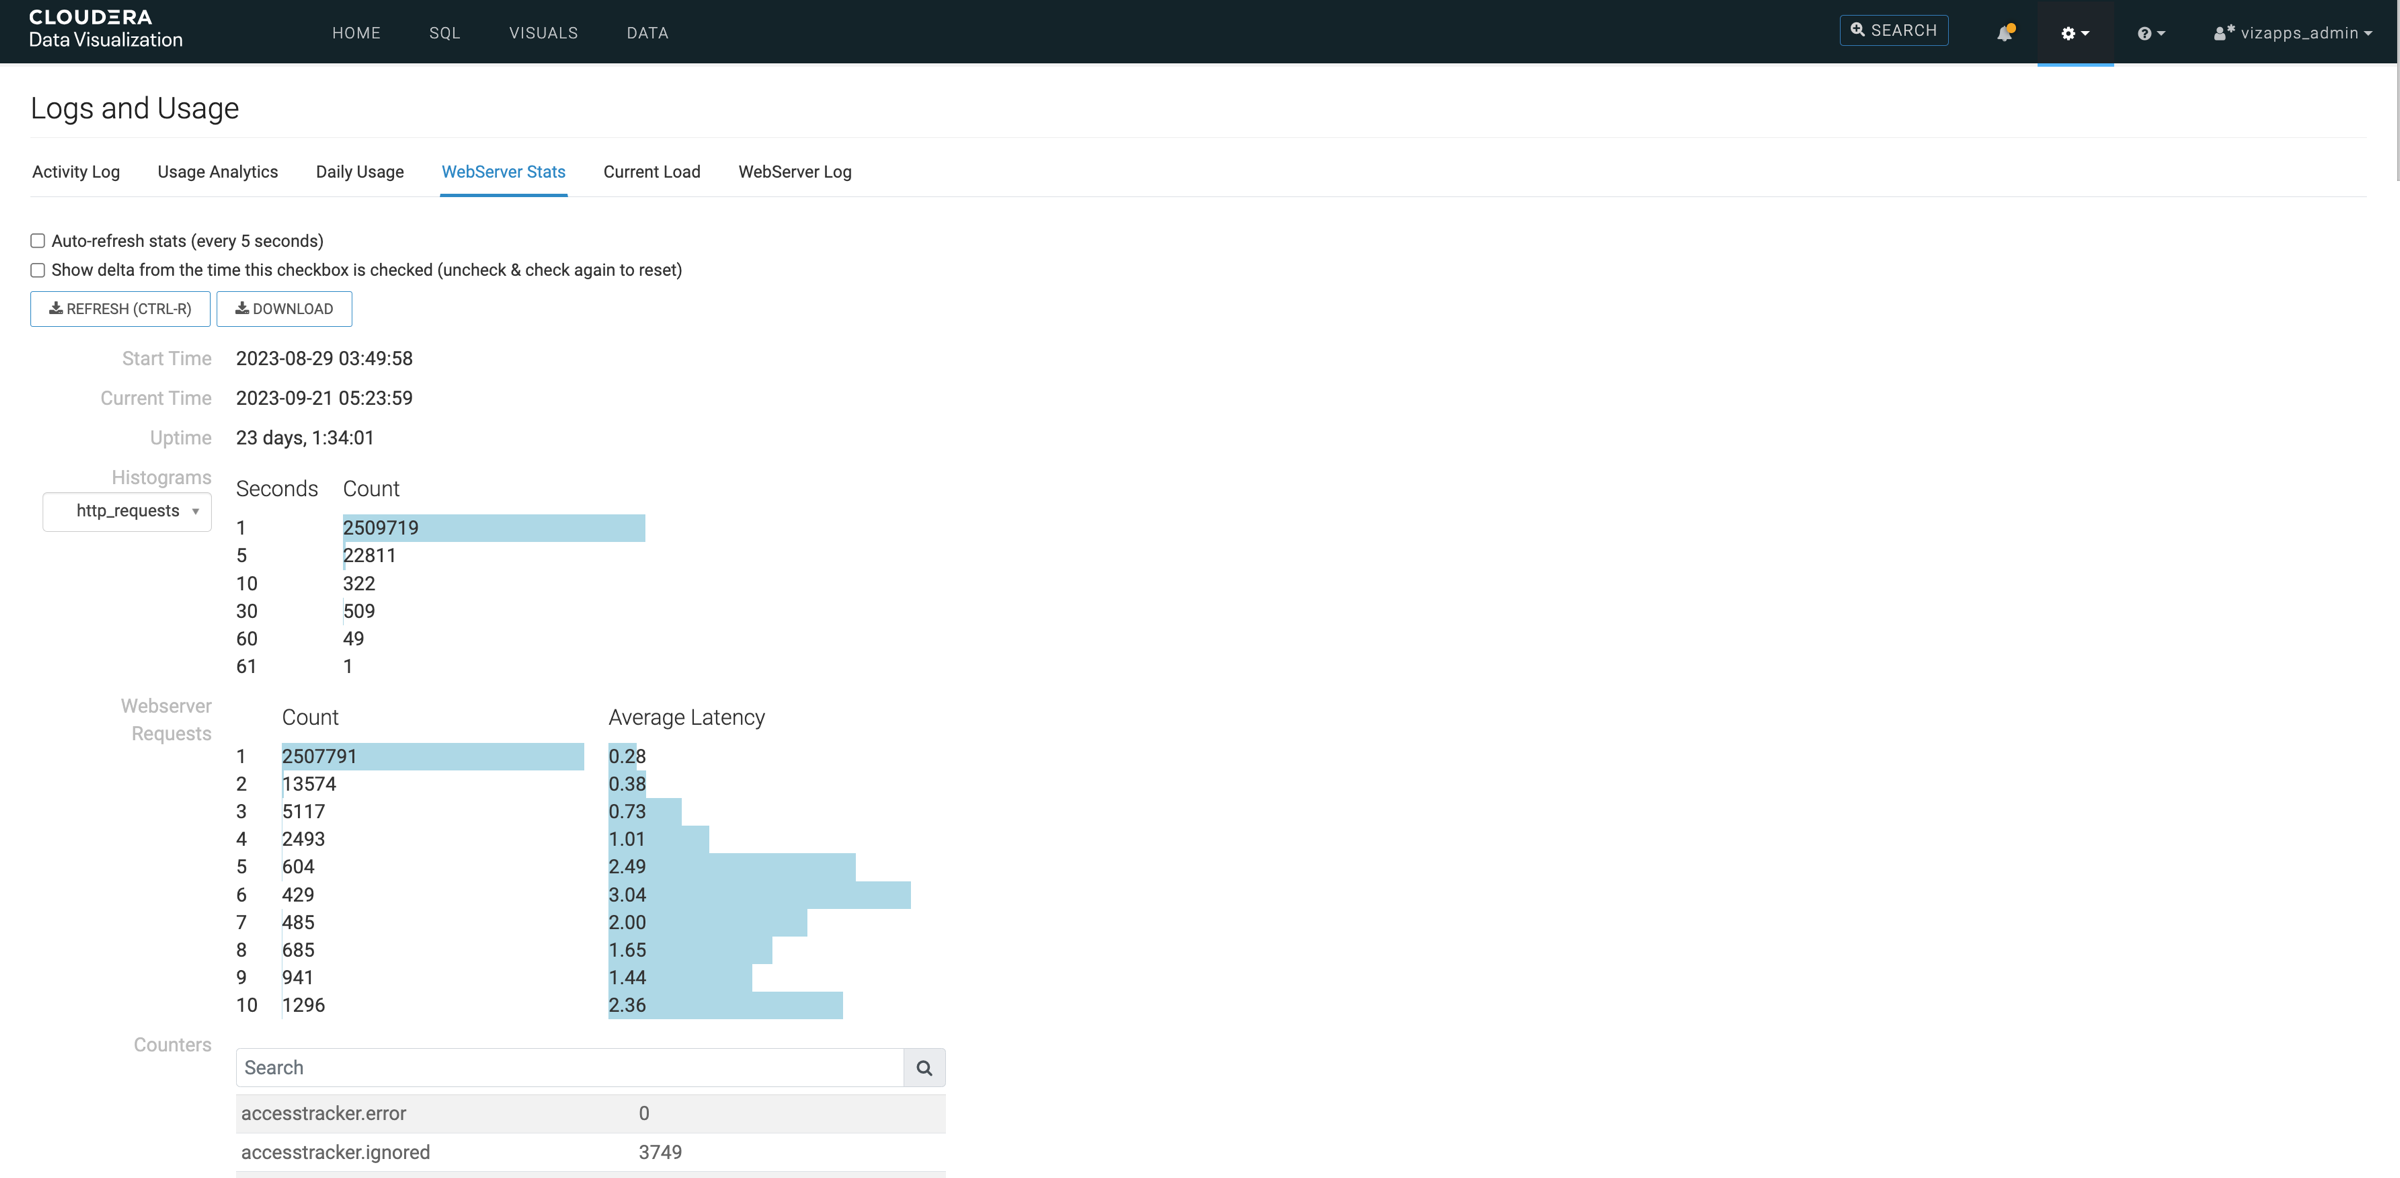
WebServer Stats
Logs and Usage is a powerful monitoring interface that can help you better understand how users are engaging with Cloudera Data Visualization in your organization. The different tabs provide you detailed information on various aspects, including user activities, system load, and runtime performance. The WebServer Stats tab of the interface provides runtime information. You can use it for performance tuning and troubleshooting. Monitoring runtime can help you identify performance bottlenecks, and plan how to optimize system performance.
You can access WebServer Stats through .
Most of the information displayed as webserver statistics is not permanently stored. Restarting the Cloudera Data Visualization instance significantly impacts the data presented.
Key features and data:
-
Auto-Refresh
You can set the interface to auto-refresh at 5-second intervals for real-time data updates.
-
Delta
You have the option to view delta information from a specific point in time.
-
Start Time
This timestamp indicates when Cloudera Data Visualization was initially started.
The default time zone for all time data received from the server is Pacific Standard Time (PST). You can configure the time zone in Advanced Site Settings. For instructions, see Time zone in the Advanced Settings documentation.
-
Current Time
It shows the time when the current page was retrieved.
-
Uptime
It shows the time elapsed since Cloudera Data Visualization was started, presented in the format of days, hours:minutes:seconds.
-
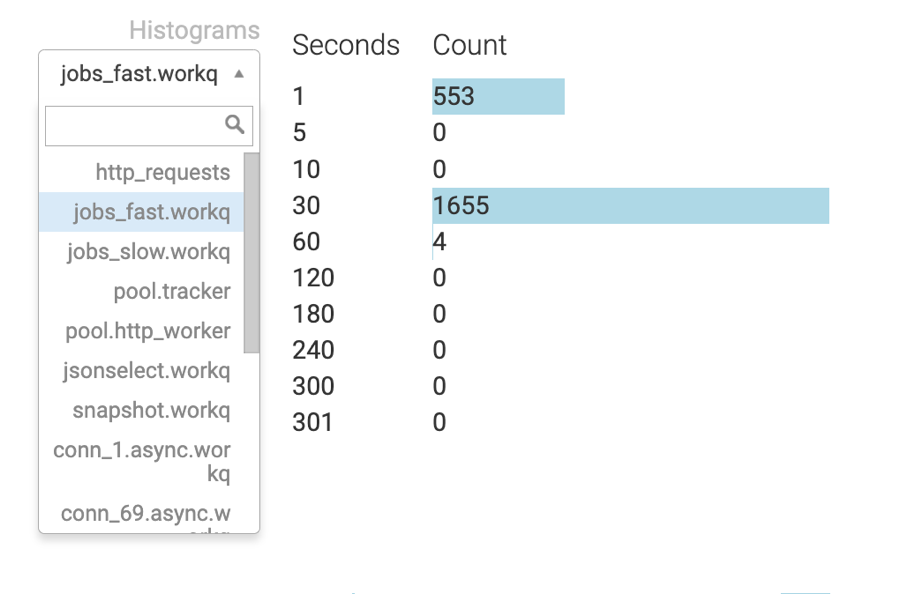
Histograms
This section provides insights into execution times within worker pools collected in several buckets (6 or 10).
Worker pools (thread pools) are used for executing tasks asynchronously, such as database queries. This view provides information on the performance characteristics of tasks executed by worker pools. It helps assess the access speed of specific data sources. The drop-down menu allows you to select different worker pools to gauge resource access speed.
-
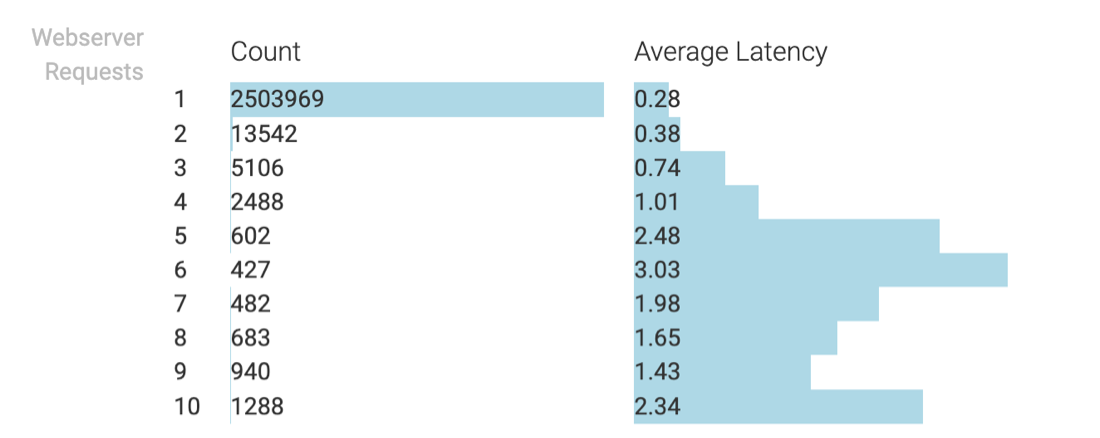
Webserver Requests
This section provides information regarding concurrent HTTP request handling. Since there are 10 HTTP worker threads, a maximum of 10 rows are displayed. The Count column shows the number of cases where the server had to manage a specific number of parallel requests (ranging from 1 to 10). The Average Latency column shows the average response time for requests within a given category.
-
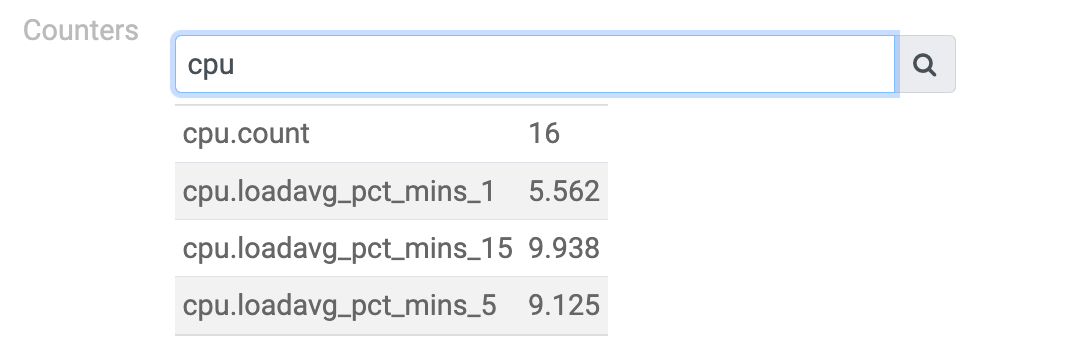
Counters
This section provides data for debugging purposes. It lists key-value pairs, where keys are dot-separated strings.
- Keys starting with cpu offer CPU-related information:
- Keys starting with conn_ are related to a particular data connection:
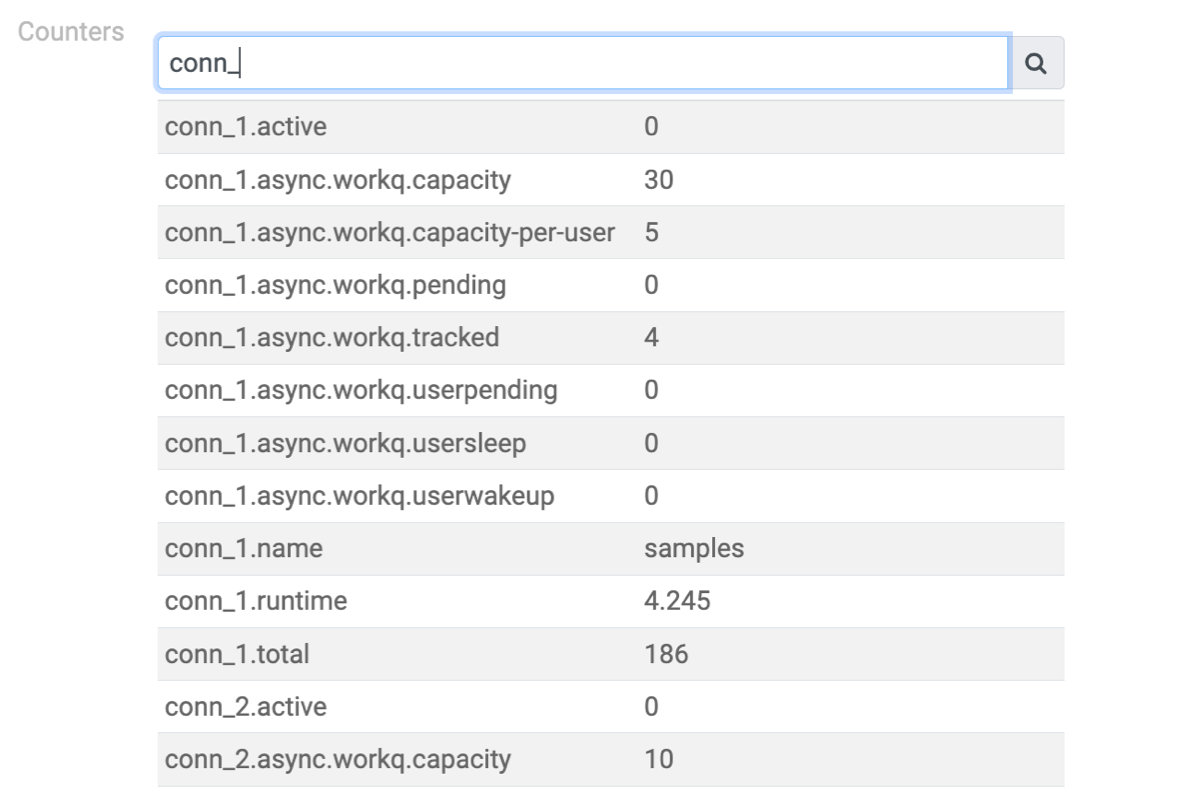
- Explanation of the connection related counters:
- active: It represents the number of queries currently being executed. A value of 0 indicates an idle connection, with no queries being executed.
- async.workq counters:
- capacity, capacity-per-user display the values of concurrency and concurrency per user settings for the data connection. These values remain constant unless you edit the data connection.
- pending shows the number of queries waiting in the queue to be processed. For an idle connection, this value is 0.
- Tracked shows the number of queries that were queued and are still awaiting to be delivered to the UI. For an idle connection, this value should be 0.
- Userpending displays the number of queries waiting for execution due to exceeding the per-user concurrent execution limit.
- Usersleep is the cumulative count of events when a query could have been executed because there were free workers in the pool, but was postponed because of the user-specific limit.
- Userwakeup is the cumulative count of events when a query was rescheduled after the user-specific concurrency dropped below the configured limit.
- name: It denotes the name of the data connection.
- runtime: It indicates the cumulative runtime of queries, excluding queue time.
- total: It represents the number of queries sent to the database backend. You can calculate the average execution time as runtime/total.
- Explanation of other counters:
- accesstracker.*: It pertains to the Access tracking feature, which is no longer in use. It always displays only ignored items.
- arcengine.create: It indicates the total number of legacy Arcengine, legacy Impala, or legacy Hive connections defined among the data connections.
- arcengine_v2.create: It indicates the total number of non-legacy Arcengine connections. Non-legacy Impala and Hive connections have their respective counters: 'impyla' and 'hyve'.
- arcengine_v2.connect: It tracks the number of times a non-legacy Arcengine connection was initiated to some of the defined data connection targets.
- async.*: It provides metrics on specific HTTP endpoints
marked as 'asynchronous'. These endpoints use a worker thread ('http_worker') to run
incoming requests, returning a task handle for client-side result polling.
- Async.jsonselect_parallel_async measures the cumulative number of scheduled tasks, typically data requests sent by dashboard visuals.
- async.asyncstatus_async captures the cumulative number of client queries checking the status of previous requests. A considerably higher count compared to 'jsonselect_parallel_async' may indicate slow data retrieval (multiple checks are needed before getting the results to the client).
- async.asyncresults_async records the number of times results were fetched by the client, which is typically low or 0, as status checks often yield data as a sign of completed processing.
- async.asynccancel_async indicates the cumulative number of query cancellations not initiated explicitly by the user, often occurring when closing the browser page before data retrieval is complete.
- Async.asynccancel_qt tracks the total number of tasks canceled explicitly by the user by clicking CANCEL ALL MY QUERIES on the current load page.
- pool.http_worker.concurrency represents the number of concurrent task executions at the time of data collection, typically 0 in an idle system.
- hive.create: It reflects the number of legacy Hive connections.
- hs2.*: (hs2.conncreate, hs2.opensession, hs2.poolcreate, hs2.queries_retry, hs2.queries_submit): It contains legacy Hive Server 2 connection-related information (no longer maintained).
- http_async.*: It offers information on the asynchronous
HTTP-handling infrastructure.
- Http_async.calls shows all HTTP client requests handled by the async framework.
- Http_async.tasks shows the number of requests that resulted in a task being scheduled.
- Http_async.retries shows the number of requests responded immediately (without scheduling a task).
- hyve.create: It tracks the number of non-legacy Hive data connections defined by users.
- hyve.connect: It monitors the number of connections established to non-legacy Hive data connections.
- Impyla.create: It tracks the number of non-legacy Impala data connections defined by users.
- impyla.connect: It monitors the number of connections established to non-legacy Impala connections.
- jobs_fast.workq.*: It contains information related to email
jobs.
- Jobs_fast.workq.capacity shows the number of worker threads assigned for email jobs.
- Jobs_fast.workq.pending shows the number of email jobs waiting to be processed. In an idle system this should be 0.
- tracked, userpending, usersleep, userwakeup all have values that are constant zeros. They are inherited from the base worker queue implementation.
- jobs_slow.workq.*: It offers data extracts related information, similar to the information jobs_fast.workq provides for email jobs.
- jsonselect.workq.*: It provides details on an additional worker pool managing data queries. Entries have the same meaning as for jobs_fast and jobs_slow counters above.
- memory.rss_mb: It displays the memory resident set size (in megabytes).
- pool.tracker.concurrency: It indicates the concurrency level, related to access tracking. This counter is currently unused.
- query_stat.*: It encompasses cumulative data for existing
data connections. In contrast to other counters, these values are persisted in the
metadata store and are not reset by a server restart.
- Query_stat.total_number_of_queries_returned shows the sum of all queries issued for all currently defined data connections since the time they were created.
- Query_stat.returned_from_backend shows the number of queries that were actually sent to the backing data source.
- Query_stat.returned_from_cache shows the number of queries that were served from the local cache.
- requests.concurrency_overflow: It reflects the number of times an HTTP request was ignored when calculating webserver requests statistics. Typically 0 due to the current concurrent limit of 10. This counter is currently unused.
- response.totalsize: It represents the total number of bytes returned by the HTTP requests, excluding streaming responses.
- rowdata.count: It captures the total number of data rows returned by non-streaming data queries.
- snapshot.queue: It shows the number of times a snapshot was created either when creating/updating a visual or when saving a dashboard.
- snapshot.workstarted: It tracks the total number of snapshoting tasks started, including snapshots created by email jobs and other actions.
- snapshot.workcompleted: It records the total number of completed snapshot tasks, typically matching snapshot.workstarted in an idle system.
- snapshot.workq.*: It contains snapshot worker queue counters, with meanings similar to jobs_fast.workq.*.
- workq.error: It shows the number of unhandled exceptions that occurred when executing tasks in worker pools. A value of 0 indicates stability.
- workq.markInterrupted: It captures the number of tasks not executed because they spent more time waiting in the queue than the specified execution timeout.
- workq.querycleanup.create: It indicates the number of times a cleanup thread was created for worker queues associated with data connections with a query timeout set. If the query timeout is modified, the cleanup thread is recreated.
- workq.querycleanup.cancels: It reflects the number of times a worker queue cleanup thread was canceled due to user changes in connection timeout settings.
- Keys starting with cpu offer CPU-related information:
-
Active Queries Summary
It provides a summary of queries/tasks executed or queued by various worker pools.

- Queue is the name of the worker pool queue.
- Capacity (Yours) shows the user-specific concurrency limit, if the queue supports it (data connection queues support it, others do not (like the http worker pool)).
- Running (Yours) shows the number of tasks/queries running on behalf of the logged-in user.
- Queued (Yours) shows the number of tasks queued for the current user.
- Capacity (All) shows the overall number of tasks that can be executed in parallel by the worker pool.
- Running (All) shows the number of all tasks executed by the pool across all users.
- Queued (All) shows all tasks waiting in the pool to be processed for all users.
-
Active Queries Detail
It provides information about tasks being executed or queued.
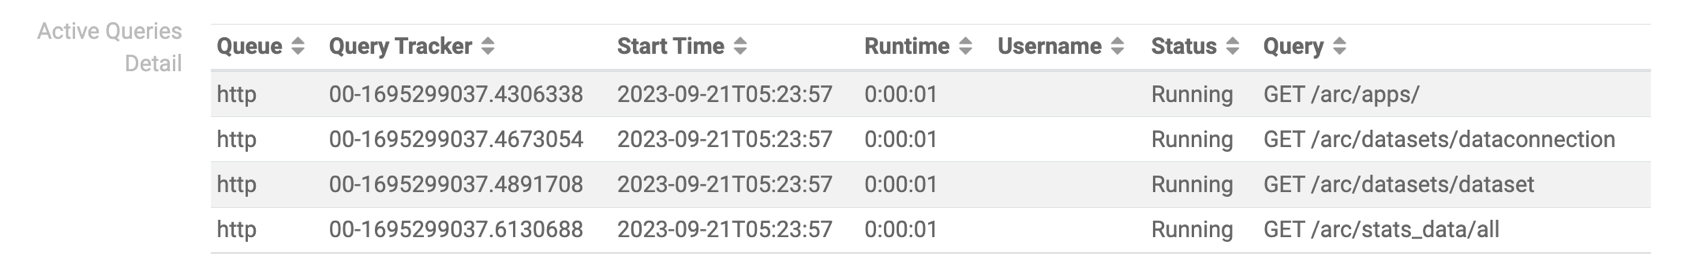
- Queue is the name of the worker pool queue.
- Query tracker is a task identifier.
- Start Time shows the time when the task was submitted to the queue.
- Runtime shows the time elapsed since the task was submitted.
- Username displays the user to whom the task belongs.
- Status indicates whether the task is Pending or Running.
- Query displays the path of the SQL query or HTTP request, if available.
