Specifying data range
You can specify the exact portion of your dataset to visualize, allowing you to focus on specific data intervals. This is especially useful for narrowing in on relevant subsets without including outliers or unnecessary values.
-
Define the range of values to focus on for your histogram.
This will define the endpoint for the histogram's x-axis.
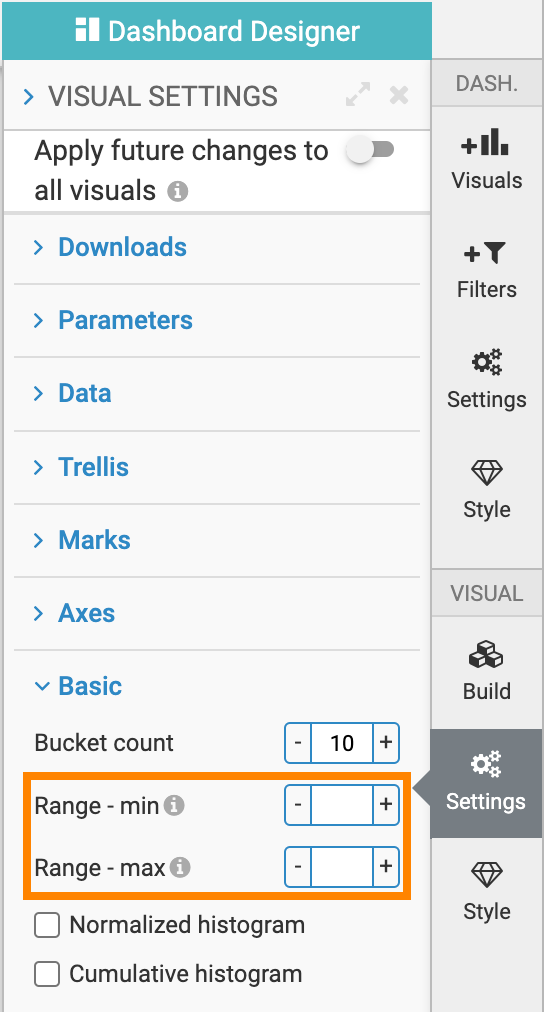
After setting these values, the histogram will automatically update to display only the data within the specified range. You can adjust the values as needed to explore different parts of your dataset.
Using the range setting, you can easily control the focus of your histogram, allowing you to isolate and analyze specific intervals of your data.
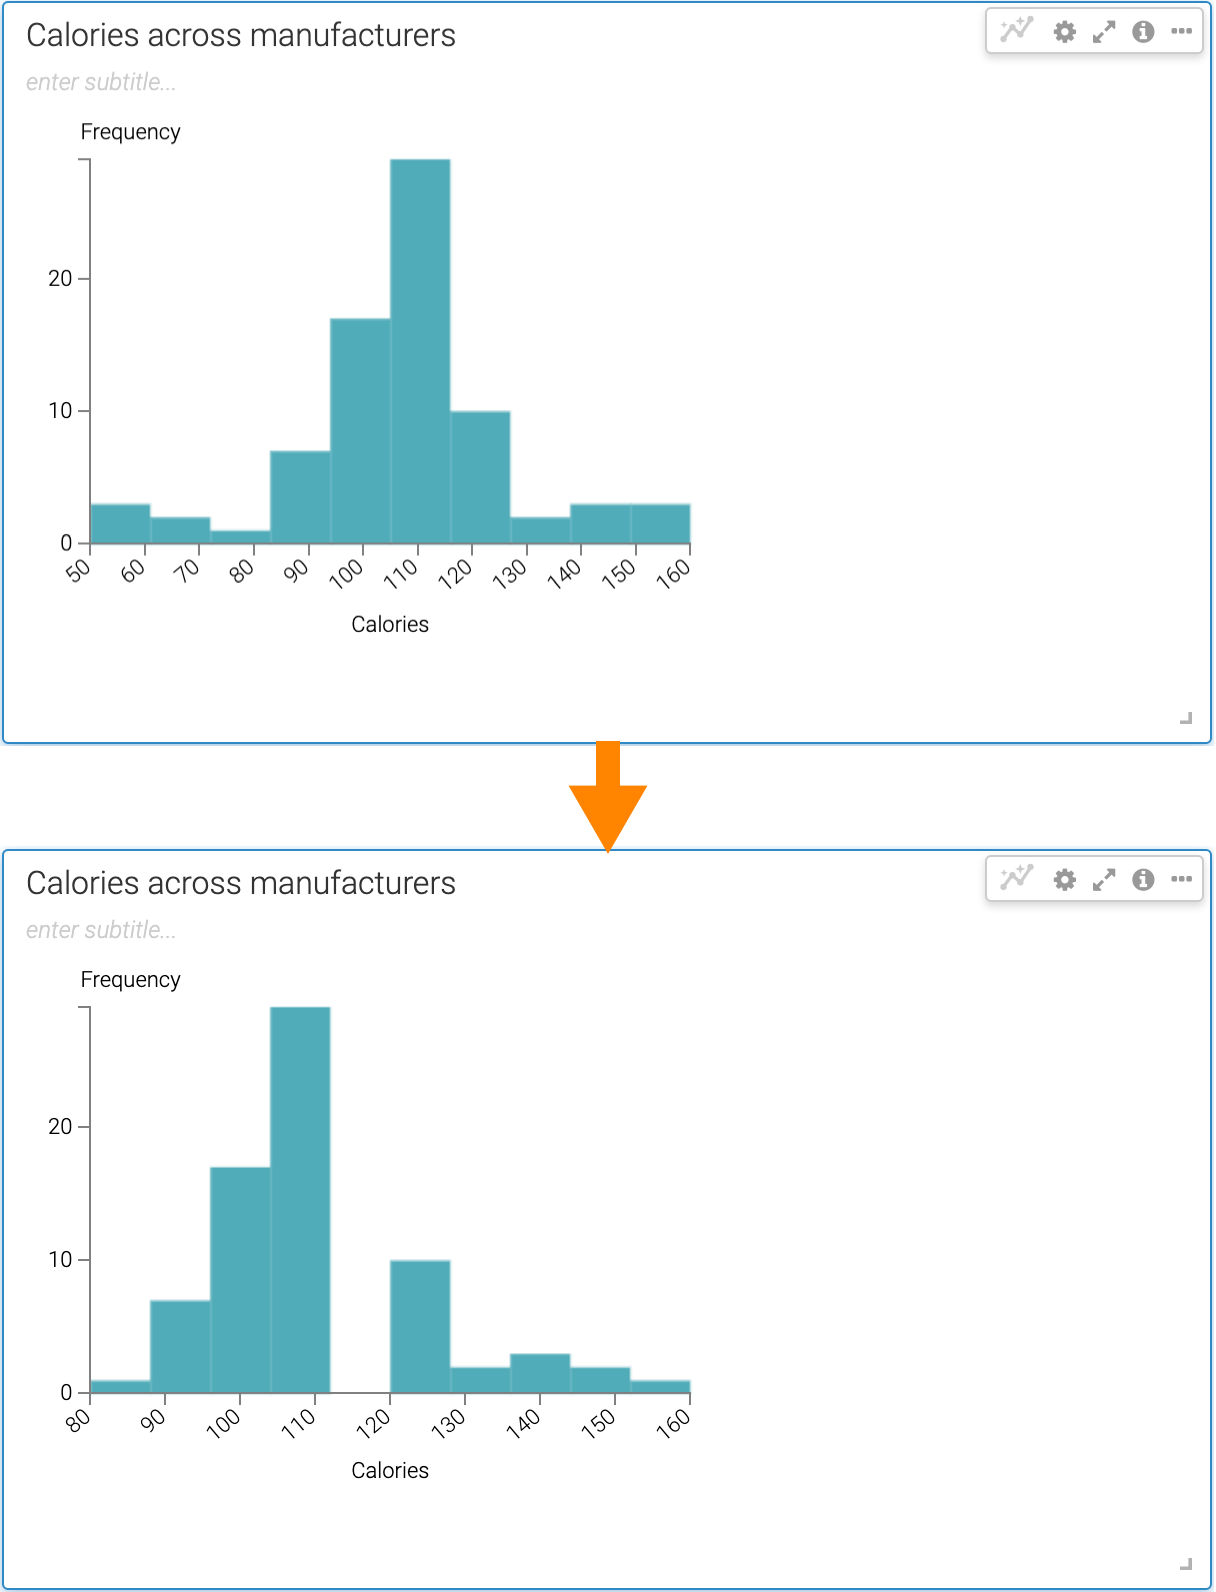
The following example shows a histogram with a wider range compared to a histogram with narrower range. You can see how adjusting the range changes the histogram’s appearance by displaying more or fewer data points.