Cloudera Data Visualization enables you to include interactive, actionable
elements in your dashboards and applications. You can use the Action visual to provide access to
external sources of information or to internal search within your dataset.
The three main use cases of the Action visual are:
Linking
You can use Action to navigate to an external website or another application, and
to move between different parts of your dashboard.
Search
You can provide a shortcut to the search pane of your current
dataset(s).
Email
You can share your visuals through email by sending out your dashboard in an
email.
The following steps demonstrate how to create an Action visual based on the Restaurant
Inspection SF dataset.
Start a new visual based on the Restaurant Inspection SF
dataset.
For instructions, see Creating a visual.
By default, a table visual is
displayed that shows all fields in the dataset.
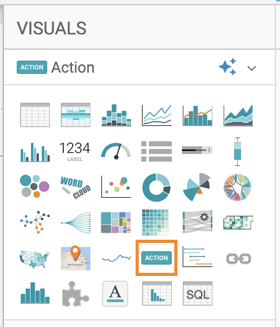
In the VISUALS menu, find and click the
Action icon.
The shelves of the visual change.
From the Type drop-down list, choose the action element you
want to add to your dashboard.
You can select Button or
Image.
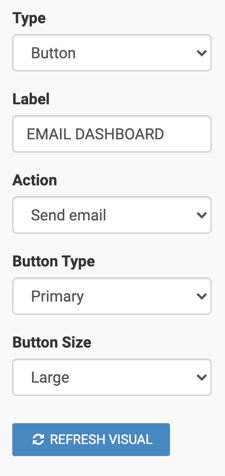
If you choose Button, the remaining shelves are the
following:
Label
Add the text you want to show on the button. The default value is ‘Click
me!’.
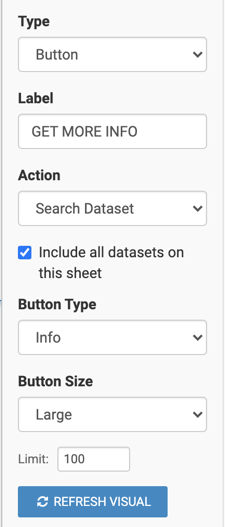
Action
Select the action you want to invoke with the button. The options available
in the drop-down list are Open URL, Search
Dataset, and Send email.
If you choose Open URL, you can add the address
of the webpage in the URL to open field.
If you choose Search Dataset, you can select an
additional checkbox whether you want to include all datasets on the
sheet.
If you choose Send email, you do not have to fill
in additional fields.
Button Type
Select the button type that you want to add. The options available in the
drop-down list have different designs. The default value is ‘Primary’.
Button Size
Select the size of the button from the drop-down list. The default value is
‘Normal’.
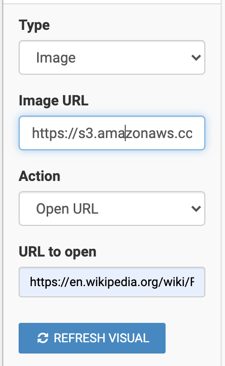
If you choose Image, the remaining shelves are the
following:
Image URL
Add the URL of the image file that you want to add to your Action
visual.
Action
Select the action you want to invoke with the button. The options available
in the drop-down list are Open URL, Search
Dataset, and Send email.
If you choose Open URL, you can add the address
of the webpage in the URL to open field.
If you choose Search Dataset, you can select an
additional checkbox whether you want to include all datasets on the
sheet.
If you choose Send email, you do not have to fill
in additional fields.
Click REFRESH VISUAL.
The updated Action visual
appears.
At the top left corner of the Dashboard Designer, click
SAVE.
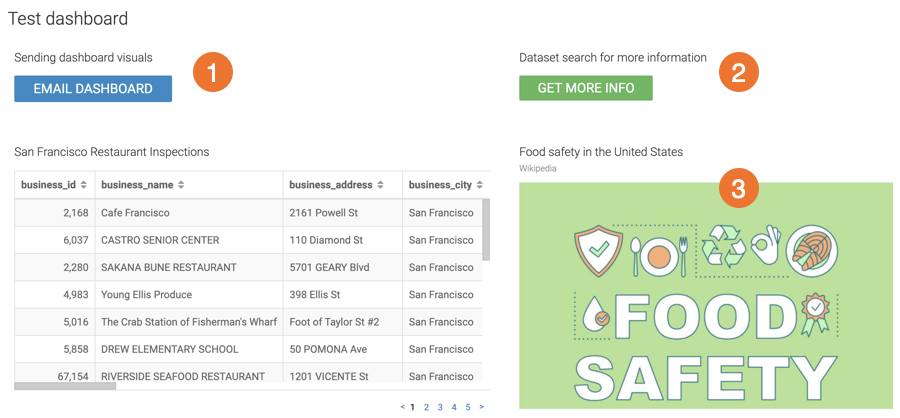
In this example, you can see a dashboard with three action visuals and a table
visual:
Action button for email
The blue Action button is a large Primary button that you can use for sending
the dashboard to an email address:
Action button for search
The green Action button is a large Info button that you can use for searching
the dataset:
Action clickable image with link
The Action image is clickable and it points to a Wikipedia page about food safety in
the US:
We want your opinion
How can we improve this page?
What kind of feedback do you have?
This site uses cookies and related technologies, as described in our privacy policy, for purposes that may include site operation, analytics, enhanced user experience, or advertising. You may choose to consent to our use of these technologies, or