
Using sparklines
Learn about using Sparkline visuals.
-
Follow these steps to create a Sparklines chart for a specific country:
-
On the Filters shelf, click
countryand click Select values.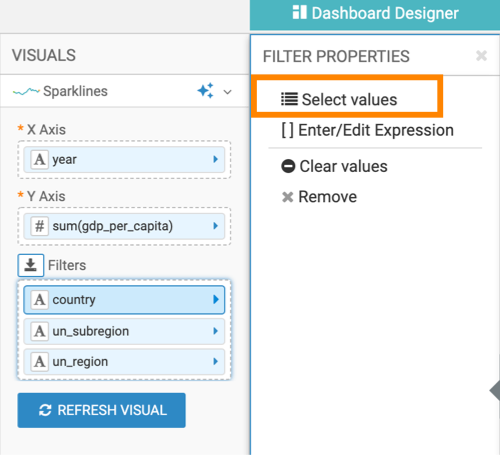
-
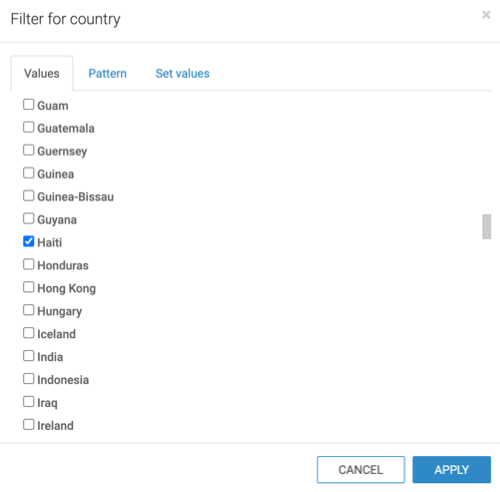
In the Filter for country modal window, select
Haiti and click APPLY.
-
Click REFRESH VISUAL.
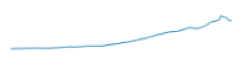
You can see how the line has changed compared to the previous display (world-wide).

-
On the Filters shelf, click
-
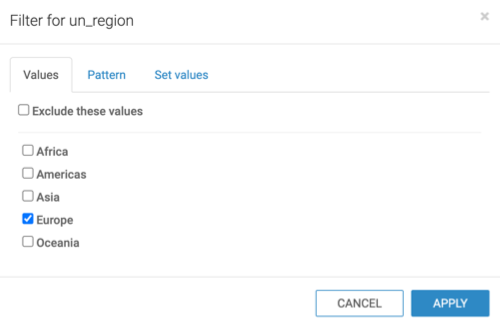
Follow these steps to create a Sparklines for a region, such as
Europe:
-
In the Filter for un_region modal window,
select Europe and click APPLY.
-
Click REFRESH VISUAL.
You can see how the line has changed.
-
In the Filter for un_region modal window,
select Europe and click APPLY.
