Drill-into data discovery
In Cloudera Data Visualization, You can drill into your data to view subsets of data across other dimensions.
Drill-into enables you to discover the more granular information for a particular data point by examining other dimensions of your data. It uses the exact portion of the graph you click to determine the filters, and the selected field as the new horizontal axis. You may further limit the fields available in drill-into.
To discover data, you must first enable the Show Drill Into context menu option in the General menu. For instructions, see Enabling Drill Into data discovery.
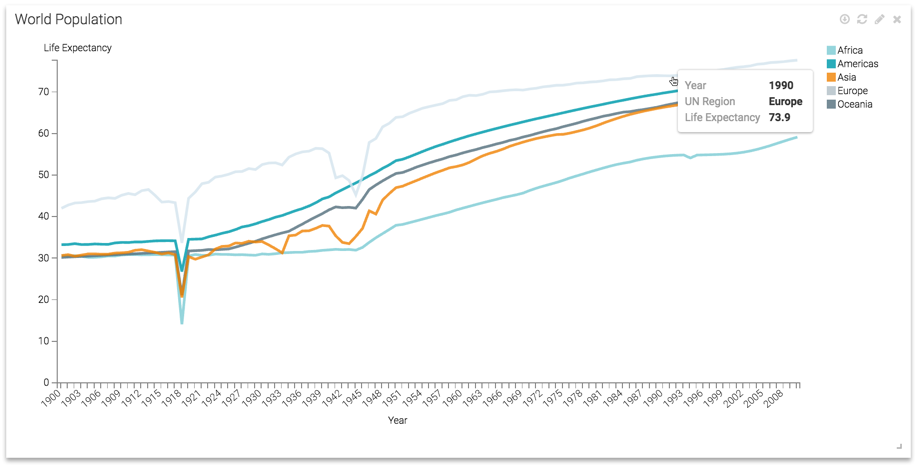
- Hover over the visual to determine what portion of the graph to examine
further.
In this example, the line for Europe, in year 1990 is selected. These values become filters in the visual generated by the drill-into choice.
- Select the Drill Into option, and then select the
appropriate field from the drop-down menu.
In this example, the
countryfield is selected.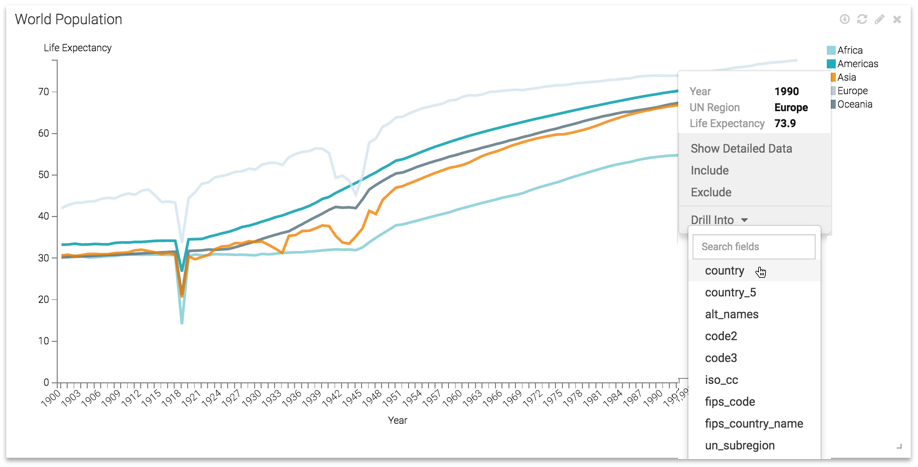
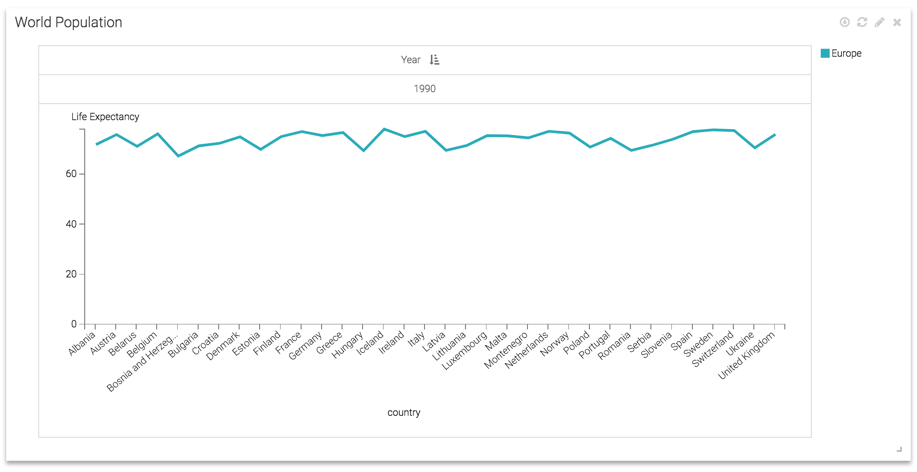
The original visual is replaced with a version that implements the filters specified earlier: Europe in year 1990. The field chosen earlier specifies the horizontal axis, where appropriate. In Choropleth Map visuals, it changes the granularity of regions represented, moving from County, to State, to County, and so on.