Cloudera Data Visualization enables you to create Treemap visuals. Treemaps
display hierarchical data as a set of nested rectangles. Each 'branch' of the tree is a
rectangle that corresponds to a particular dimension, with smaller rectangles that represent
secondary dimensions. All rectangle areas are proportional to the aggregate measure that
corresponds to the dimension.
Using color and size dimensions in the tree structure often brings to light new insights
and correspondence patterns. Because of the highly efficient use of space, treemaps legibly
display very large number of items simultaneously.
In the following example the NYC Taxi Trips dataset is used, which is based on the
data in the ny-trips.csv file.
For an overview of shelves that specify this visual, see Shelves for
treemaps.
Start a new visual based on the NYC Taxi Trips dataset.
For instructions, see Creating a visual.
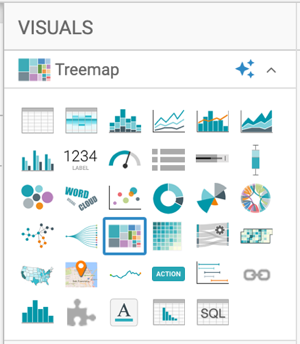
In the VISUALS menu, find and click
Treemap.
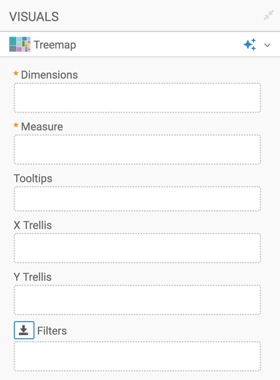
The shelves of the visual changed. They are now Dimensions,
Measure, Tooltips, X
Trellis, Y Trellis, and
Filters. The mandatory shelves are:
Dimensions: specify one or two dimensions to define the
branches and leaf nodes of the treemap.
Measure: specifies one measurement that determines the area
of the leaf node.
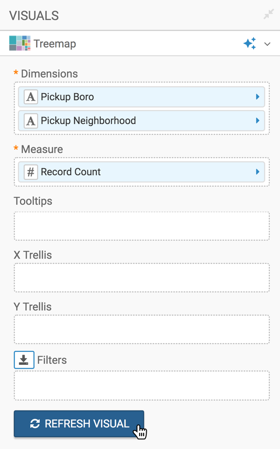
Populate the shelves from the available fields (Dimensions and
Measures) in the DATA menu.
Under Dimensions, select Pickup Boro and
Pickup Neighborhood, and add them to the
Dimensions shelf, in that order.
Under Measures, select Record Count and add
it to the Measure shelf.
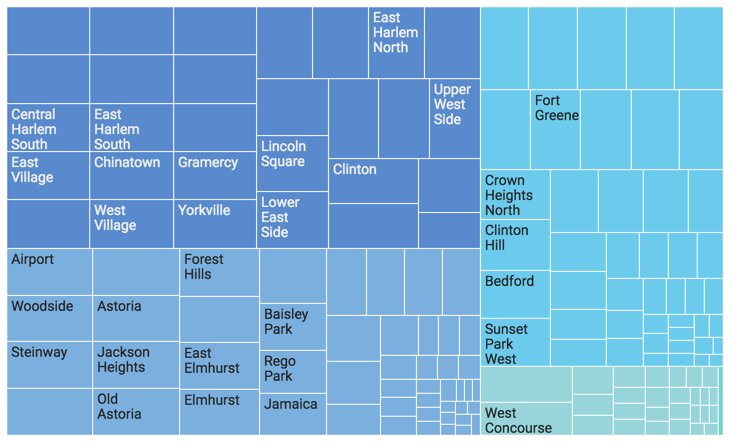
Click REFRESH VISUAL.
The new treemap visual appears.
Click the pencil/edit icon next to the title of the
visualization to enter a name for the visual.
In this example, the title is changed to 'NYC Taxi - Treemap'. You can also add a brief
description of the visual as a subtitle below the title of the visualization.
At the top left corner of the Dashboard Designer, click
SAVE.
To adjust the treemap display, check all the available settings for this visual.
We want your opinion
How can we improve this page?
What kind of feedback do you have?
This site uses cookies and related technologies, as described in our privacy policy, for purposes that may include site operation, analytics, enhanced user experience, or advertising. You may choose to consent to our use of these technologies, or