Assigning a measure to a secondary axis
Sometimes plotting two measures on the same axis does not show the bars because of their relative values, or because of their incompatible units of measurement. To be able to clearly see both a line and the bars in a Combined Bar/Line (Combo) visual, Cloudera Data Visualization enables you to specify a separate axis for each of the measures in the combined visual.
-
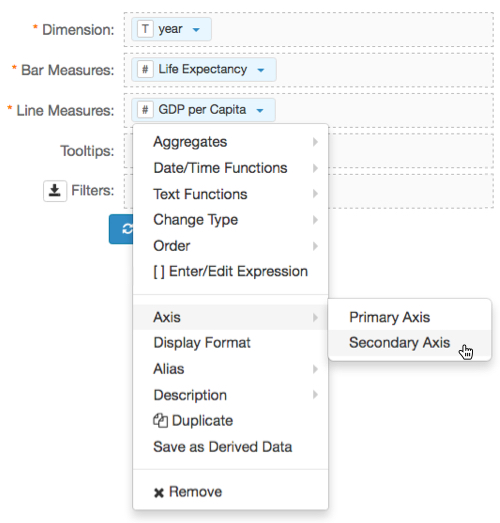
Assign the 'GDP per Capita' field to the secondary axis:
-
Select .
-
Select .
-
Click REFRESH VISUAL.
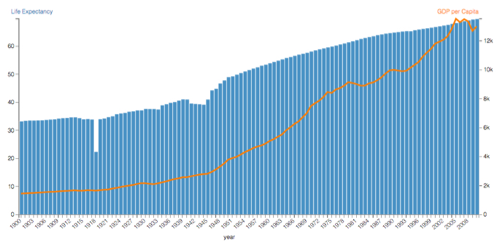
Both the blue bars and the orange line are now clearly visible.
The graph lists Life Expectancy on the left-hand vertical axis, in the range of 0 to 70, and the GDP per Capita on the right-hand vertical axis, in the range of 0 to 14k.