Displaying subtotals and totals

You can expand and shrink the data rows, and display only subtotals and combined total in a Cross Tabulation visual.

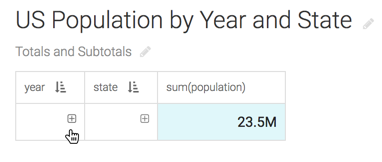
  1. Click the + icon in the year column.

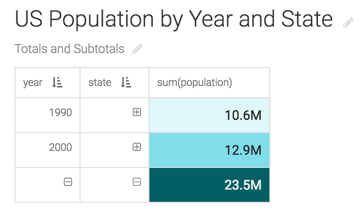
    The visual expands the data to show subtotals of each year, and combined total for both years.

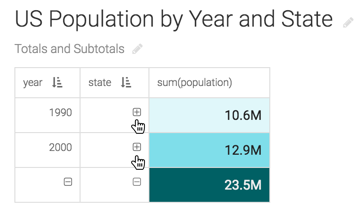
  2. Click the two + (plus) icons in the state column.

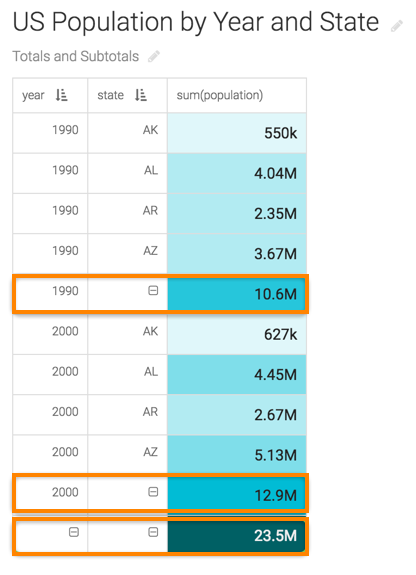
    The visual expands the data to show population in each state, and the subtotals and combined population for both years. The subtotals and combined total appear at the bottom of expanded rows. To move the subtotals and totals over the rows, see Showing expansion totals above expansion rows.

To disable subtotals and combined totals, make changes in the FIELD PROPERTIES menu by de-selecting the Enable Expansion option.