Row number function
This article describes how to use the Row Number analytic function in Cloudera Data Visualization.
-
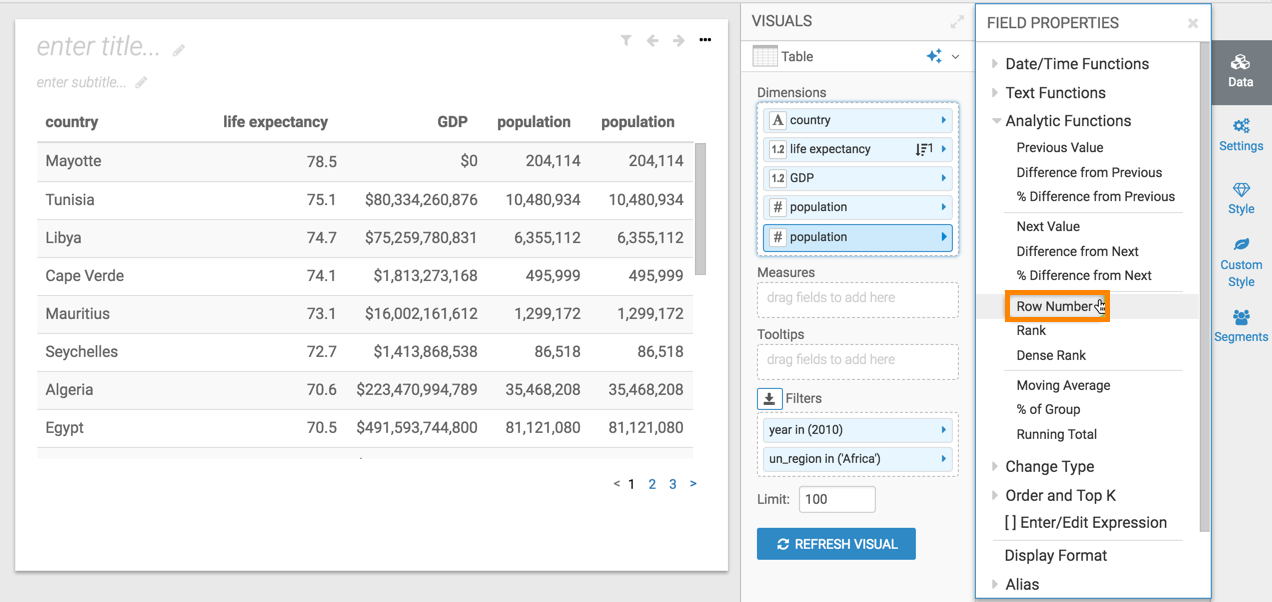
In FIELD PROPERTIES, expand Analytic
Functions, and select Row Number.
-
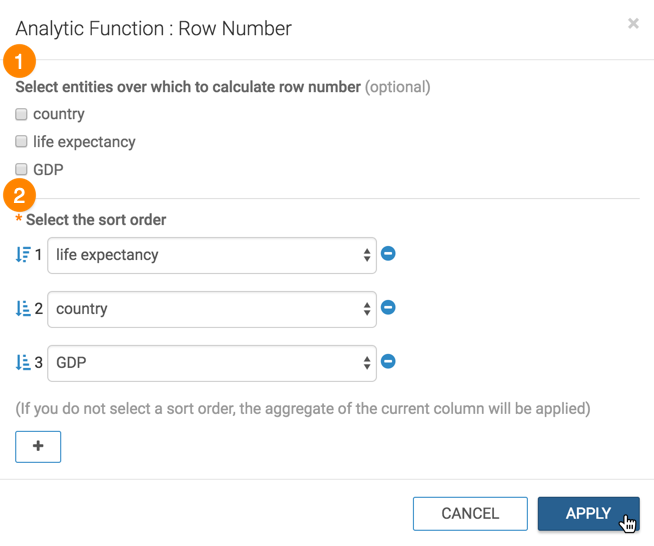
In the Analytic Function: Row Number modal window:
-
Under Select entities over which to calculate row number, you can select any of the fields: country, life expectancy, or GDP. This is the grouping that applies when calculating the row number.
-
Under Select the sort order, you can specify the order of sorting. This order specifies what the row is, and the row where the value is taken. If your visual already specifies sorting order, these values appear in the modal.
In this example, leave the default order: life expectancy descending, followed by country and GDP, both ascending.
-
-
Click REFRESH VISUAL.
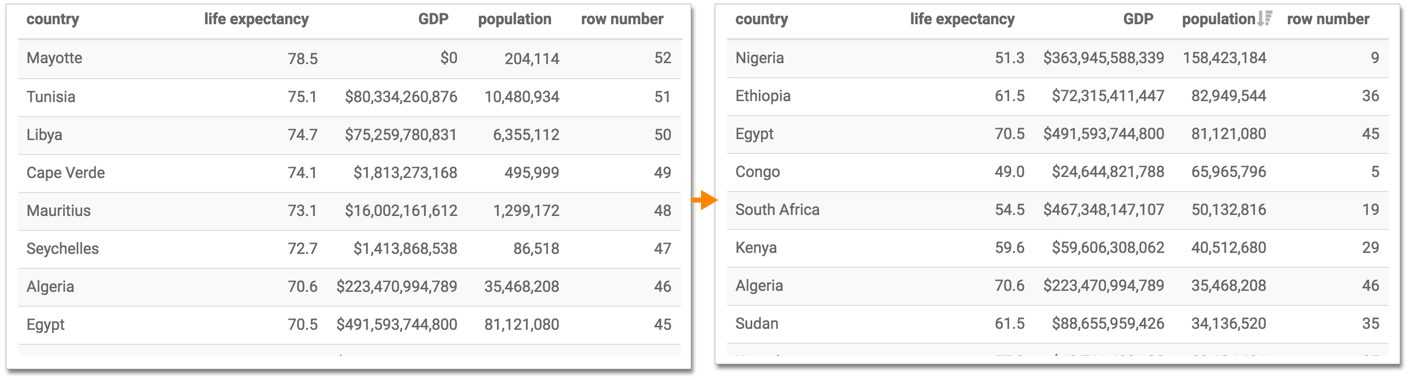
You can see that initially, the row number numbers are descending, following the order of the primary sorting column, life expectancy. If you sort the table on another column, such as population, the row number numbers appear disordered.