Networks: link color shelf
By default, the links of the network visual have the same thickness and length. Network visual has a data shelf called Link color that uses a specified palette to plot different link colors.
-
Click REFRESH VISUAL.
You can see the change to the appearance of the visual:
Figure 1. Specifying the link color shelf in a network visual 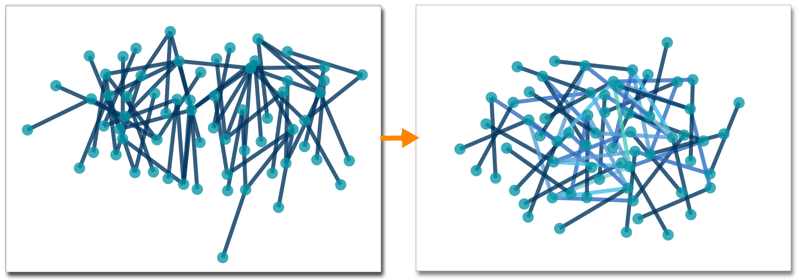
- Optional:
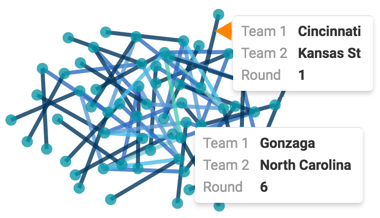
If you hover over a specific link, you can see the detail information. For example,
the dark-colored links represent Round 1 games, and the lightest link in the middle is the
final game, Round 6.
Figure 2. Tooltips on a network visual with active link color shelf