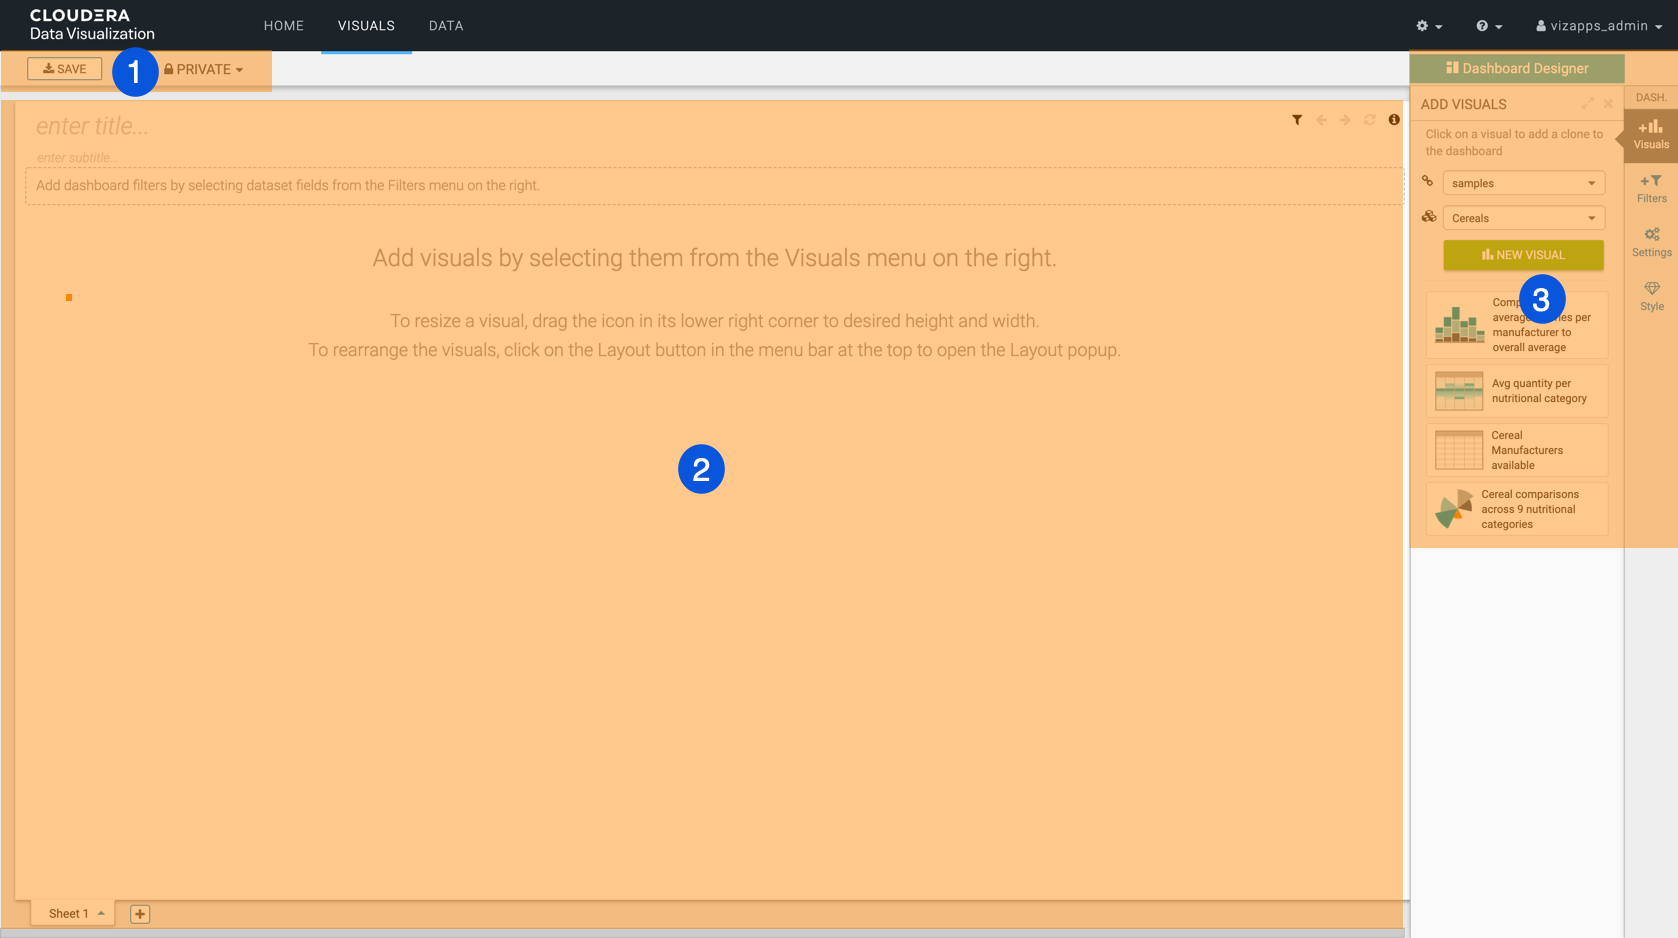
The Dashboard Designer of Cloudera Data Visualization
provides an intuitive interface for building dashboards that help you to collect, organize, and
display related visuals. You can add or link the visuals you have created based on datasets from
the same connection or across different connections.
Using the Dashboard Designer interface, you can create
visuals and arrange them on dashboards with ease.
The Dashboard Designer page has the following main parts:
Dashboard Designer top menu bar
Dashboard preview area
Dashboard Designer side menu bar
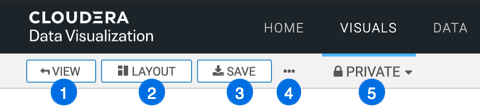
Dashboard Designer top menu bar
This menu bar houses various functions and options for designing and customizing your
dashboards.
The VIEW button allows you to preview the dashboard at runtime.
It becomes accessible on the menu bar after saving your dashboard. When you open an
existing dashboard, it is initially displayed in View mode. To make edits or add
new visuals, simply switch to Edit mode by clicking the EDIT
button. You can switch back to View mode by clicking the
VIEW button.
The LAYOUT button allows you to modify the layout of the
dashboard. It appears on the menu bar once your dashboard has been saved. For more
information on adjusting the arrangement of visuals on a dashboard, see Customizing
dashboard layout.
The SAVE button allows you to save all changes made to the
dashboard.
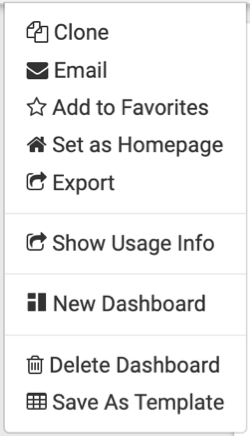
The Supplemental menu offers access to additional functions:
Clone lets you clone the current dashboard.
Email allows you to create an email job for the current
sheet.
Add to Favorites lets you mark frequently-used dashboards as
favorites for quick access. This option becomes available after you have initially
saved your dashboard.
Set as Homepage lets you change your home screen to the
current dashboard. This option is accessible once you have saved your dashboard.
Export allows you to export all dashboard elements. This
feature is enabled after saving your dashboard.
Show Usage Info provides access to profile data, providing
insights into usage. For more information, see Showing usage
information.
New Dashboard lets you create a new dashboard.
Delete Dashboard lets you remove the current dashboard.
Save As Template allows you to use the current dashboard as a
new temaple. Templates facilitate the rapid creation of dashboards from a
dataset.
The workspace selector allows you to assign your dashboard to a different workspace.
Dashboards can belong to public, private, or a custom workspace, but they can only exist
in one workspace at any time.
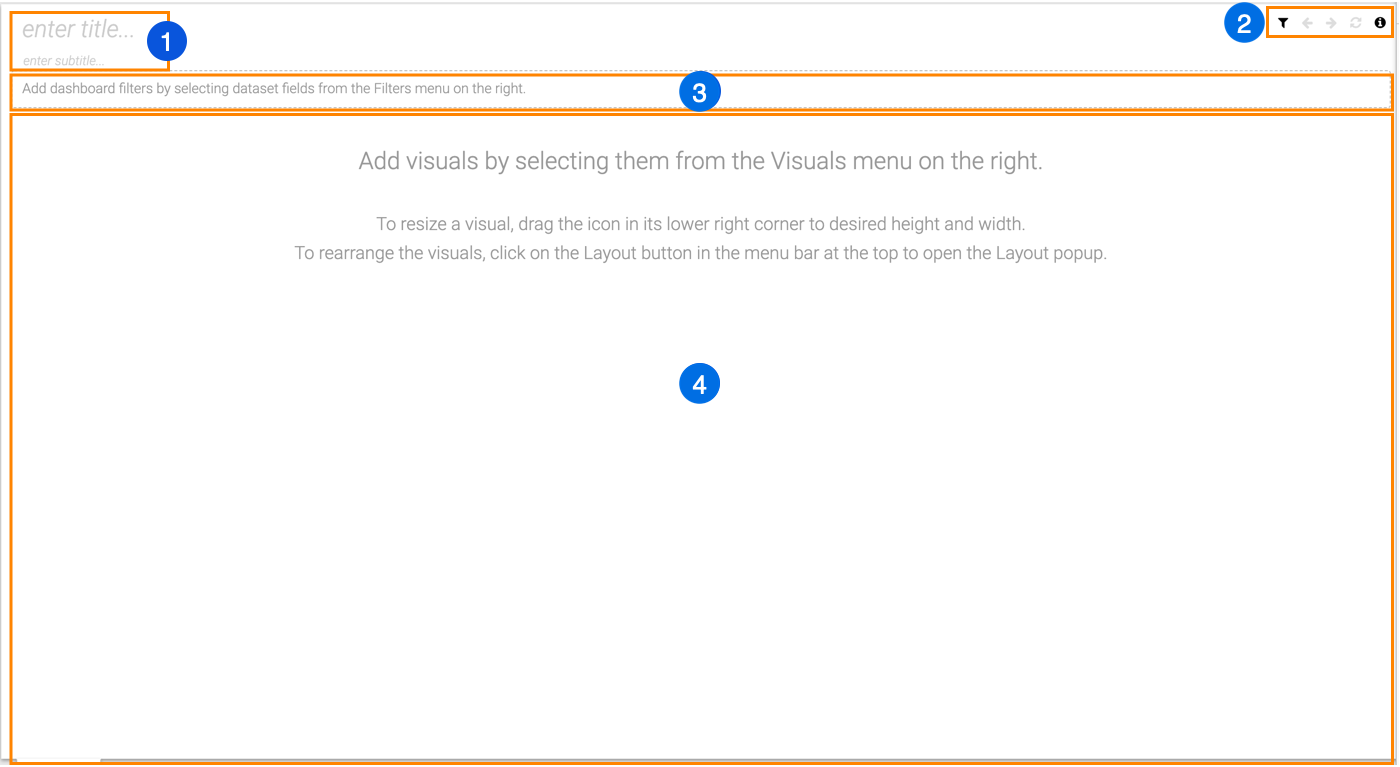
Dashboard preview area
The dashboard preview area shows the contents of the dashboard, that is all filters and
visuals you have added to it. You can also find here the title and subtitle of the
dashboard. When you start building a new dashboard, this area is empty.
The title area contains two editable fields where you can add the title and subtitle of
your choice. Both are empty when you create a new dashboard.
enter title...
enter subtitle...
Dashboard actions
Parameters
Back
Forward
Reset
Information
When you save a new dashboard the supplemental menu icon is added to the dashbord
actions offering the following options:
Email – You can use it to send the dashboard in an email.
For more information, see Emailing a dashboard
Download as... – You can use it to download the dashboard
as an image or in PDF format. For more information, see Downloading a
dashboard
Get URL – You can use it to obtain the default URL of the
dashboard or generate a short URL for it. For more information, see Getting
the dashboard URL.
The filter area contains the filter controls that allow you to dynamically change the
dashboard presentation at run time. Filters can be defined on any column of the dataset by
pulling the appropriate field from the Filters menu.
The visuals area contains the visuals of the dashboard. It is empty when you create a
new dashboard. To add visuals, use the Visuals menu.
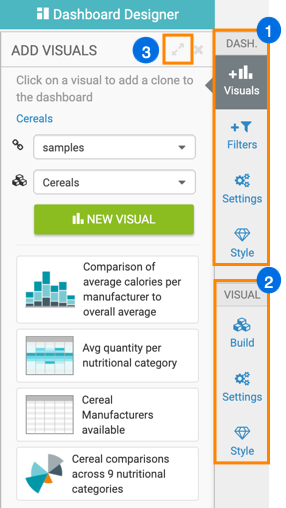
Dashboard Designer side menu bar
The dashboard menu selector enables you to choose between
different menus in the Dashboard Designer.
Visuals – This menu allows you to add visuals to your
dashboard.
Recently Created Visuals show you the new visuals added
recently.
The Connection drop-down list lets you select an
alternate connection. It is available in both the Visuals
and Filters menus.
The Dataset drop-down list lets you select an alternate
dataset. It is available in both Visuals and
Filters menus.
The NEW VISUAL button enables you to start a new visual
from within the dashboard.
Existing visuals that belong to the specified dataset are displayed lower on the
menu. Changing the dataset gives access to other visuals. You can click the
visuals to add them to the dashboard.
Filters – This menu allows you to add filters to your
dashboard.
The CREATE CUSTOM FILTER button allows you to create a
custom filter based on any parameter and add it to your dashboard.
The Connection drop-down list lets you select an
alternate connection. It is available in both Visuals and Filters menus.
The Dataset drop-down list lets you select an alternate
dataset. It is available in both Visuals and
Filters menus.
Dimensions show you all fields by dataset that you can
use as a filter.
Measures show you all fields by dataset that you can use
as a filter.
Settings – This menu provides you with several options for
dashboard display settings.
General
Filter Settings
Downloads
See Customizing general settings for dashboards for more
information.
Style – This menu provides you with various styling options
for dashboards.
Dashboard Basics
Dashboard Title
Dashboard Subtitle
Filters
Visual Borders
Custom Style
See Customizing style for dashboards for more information.
If you already have a visual or visuals available in the dashboard and you are working
on one of them, you can also see the visual menu selector in the
side menu bar. It enables you to choose between different menus in the Visual
Builder.
Build
Settings
Style
For more information about these visual menu options, see Visual
Builder.
At the top right corner of the Dashboard Designer side menu, you
can click the [expand] icon to increase its width. To decrease the
size of the pane, you can click the [compress] icon.