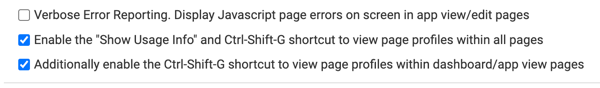
Showing usage information
Cloudera Data Visualization helps you debug your dashboard performance by providing detailed statistics on the rendering and querying operations of the visuals.
-
In the Dashboard Designer top menu bar, click the
(ellipsis) icon and select Show Usage
Info.
Alternatively, you can use the keyboard shortcut Shift + Control + G to open the modal.
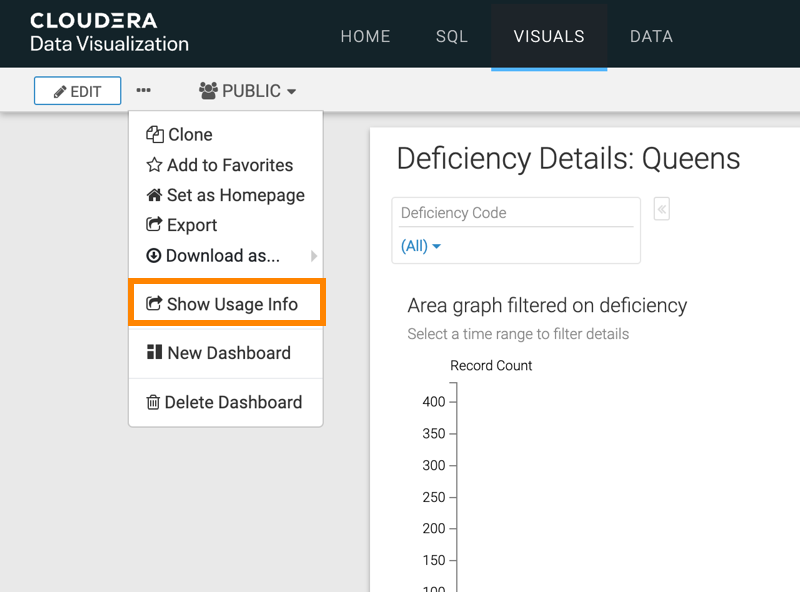
The Profile Data modal window is displayed.
-
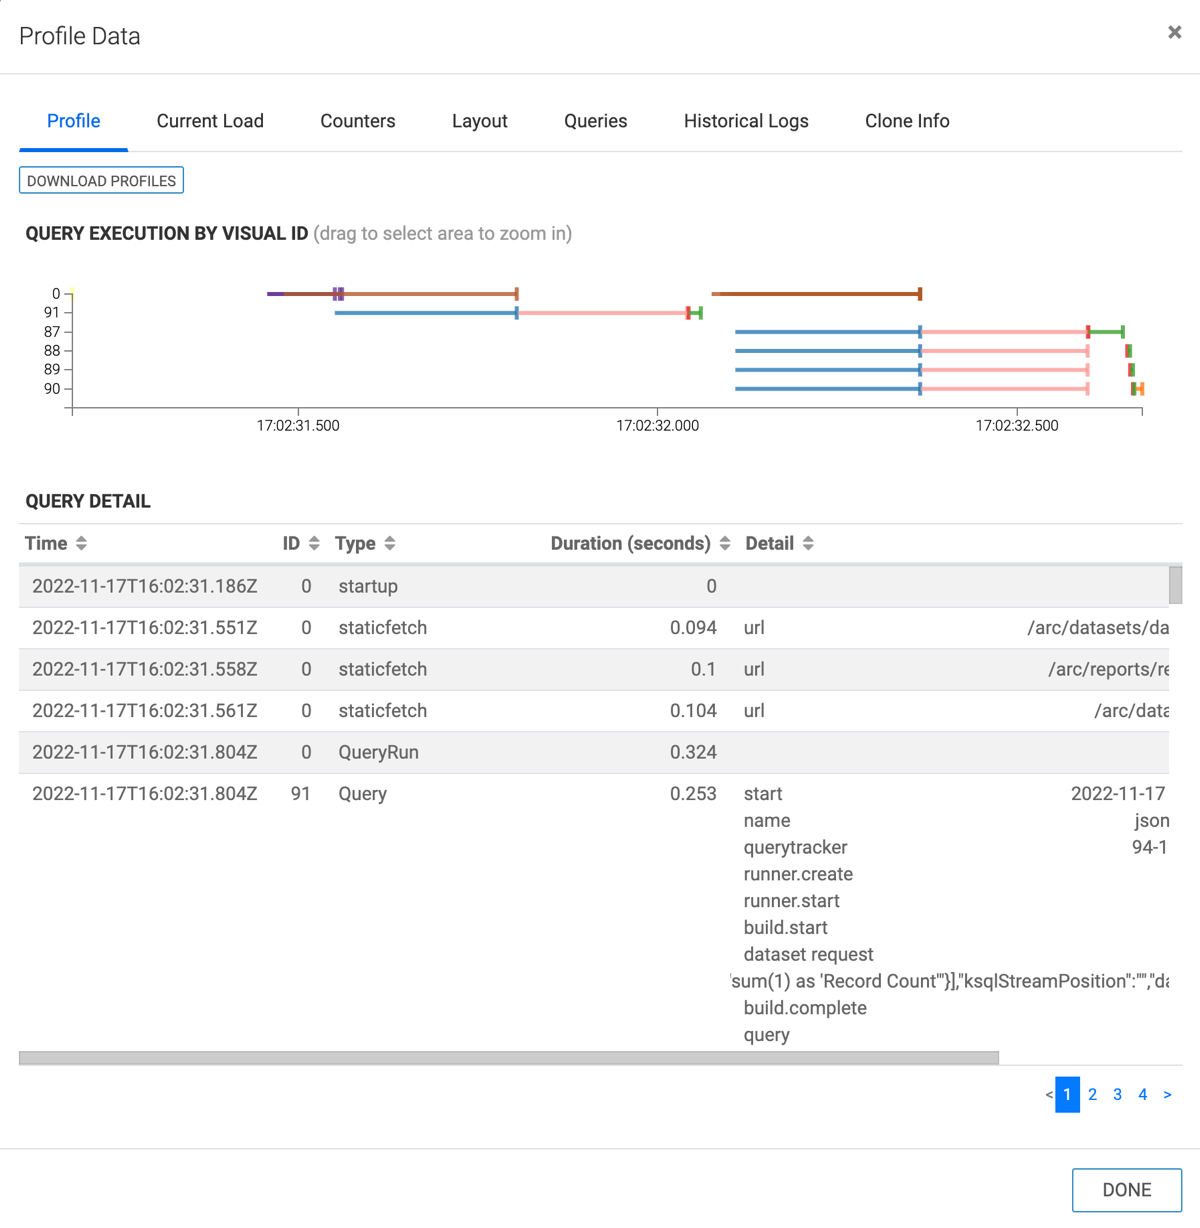
You can view the following information on the Profile
Data interface:
- Profile tab
-
- Download profiles – Click it to download the performance profile of your dashboard as a text file and save it to your local system.
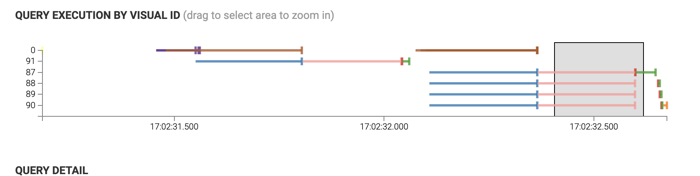
- Query execution by visual ID – You can use this
visual to check the timeline of each operation.Hover over one of the time segment lines that represent either the visual, or additional tasks. The tooltip shows the Duration, ID, Type, Detail, and Error statistics.
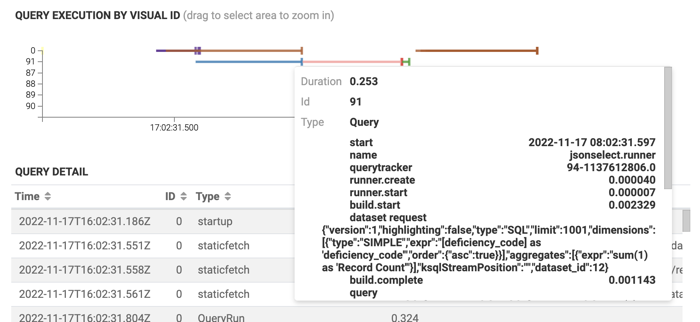
- The ID of the visual is ‘91’ in the above image. This is the stand-in ID for ancillary tasks Cloudera Data Visualization performs when building a dashboard.
- You can hover over a line that represents a visual ID (in the above example ‘91’), and view the duration, type, and details of the query performed on that visual.
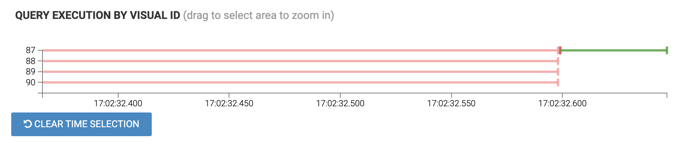
- To zoom in on a particular time segment, drag to
select the area. You can now drill down to the
details of this time selection. Click Clear Time
Selection to return to the original view. In the
following example 17:02:32.500 is selected.
- Query detail – This section shows statistics of all the
visuals and queries in a table.
- Time shows the time when the query operation started.
- ID shows the ID of the visual.
- Type shows the query type: startup, set data result, draw visual, or table rows processed.
- Duration shows the query execution time, in seconds.
- Detail shows the syntax of the query.
- Error shows any errors that occurred during query execution.
- Current Load tab
- You can see a summary of active and pending queries. You can also manage your queries: refresh the queries, cancel all your queries, or download the query data.
- Counters tab
-
- Rendering Engine – The table shows real-time
statistics for rendering operations on all visuals of the
dashboard:
- Average Render Time
- Total Render Time
- Render Count
- Maximum Render Time
- Query Engine – The table shows real-time
statistics on the query operations:
- Average Query Time
- Total Query Time
- Query Count
- Maximum Query Time
- Total Result Rows
- Rendering Engine – The table shows real-time
statistics for rendering operations on all visuals of the
dashboard:
- Layout tab
-
- Datasets – It shows you the ID of the datasets used on the dashboard.
- Page layout – The widgets show you how the visuals are arranged on the dashboard and which datasets are used.
- Top left color squares represent datasets.
- Queries tab
- You can see a list of queries. You can download the query data as a
CSV file and save it to your local system.
This section shows the following for each query that was initiated from the dashboard:
- Time shows the time when the query operation started.
- Dataset shows the ID of the dataset.
- Visual shows the ID of the visual.
- Runtime shows the query execution time in seconds.
- Query shows the syntax of the query. Hovering on the information icon will show this data in a formatted manner where it can be copied to clipboard.
- Historical Logs tab
- Historical Logs show the list view for activities on this dashboard. For more information, see Activity Log.
- Clone Info tab
- Clone Info provides information about the clones of the dashboard. The table on the left shows the ancestor chain, and the table on the right shows the immediate children of the dashboard.