The Visual Builder of Cloudera Data Visualization is an
intuitive user interface for creating data visualizations. You can access the interface within
the Dashboard Designer.
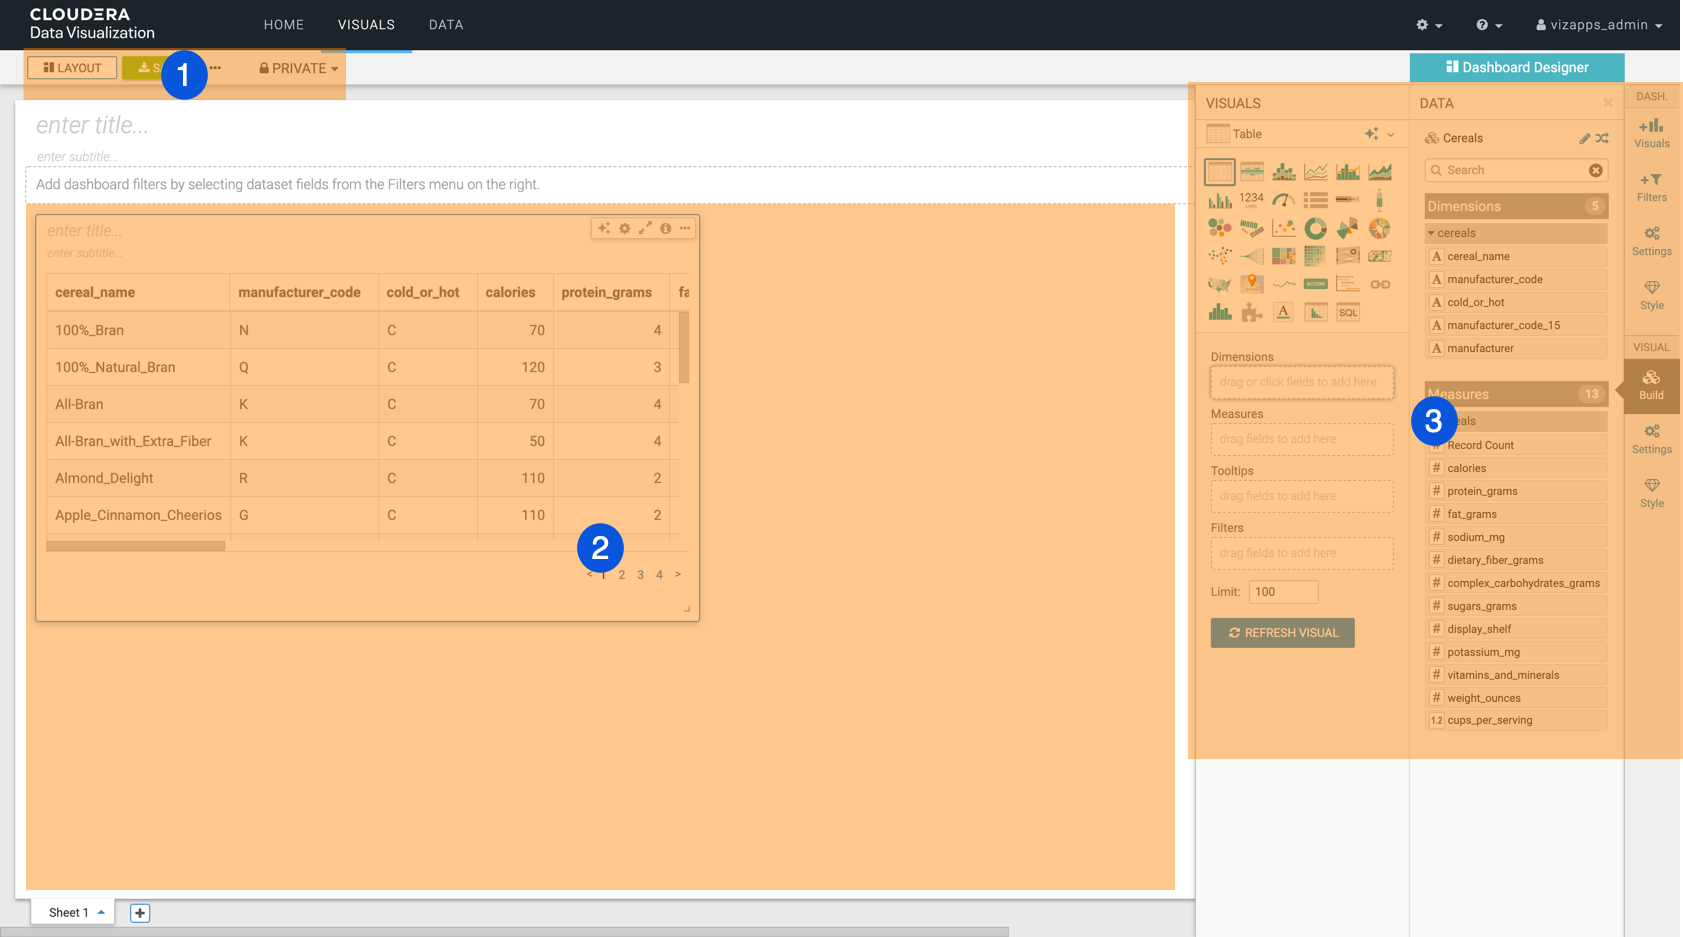
The Visual Builder page has the following main parts:
Visual Builder top menu bar
Visual preview area
Visual Builder side menu bar
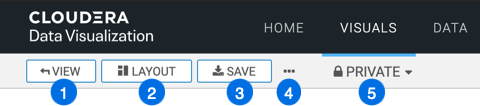
Visual Builder top menu bar🔗
The VIEW button allows you to preview the dashboard at runtime.
It is only displayed on the menu bar if you already saved your dashboard.
The LAYOUT button allows you to edit the layout of dashboard
visuals. It is only displayed on the menu bar if you already saved your dashboard.
The SAVE button saves all changes to the dashboard.
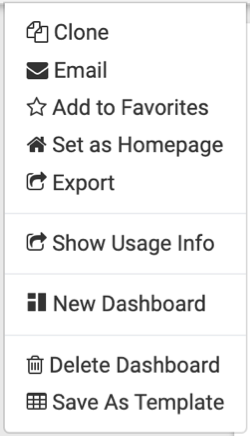
The Supplemental menu provides access to additional
functions:
Clone lets you clone the current dashboard.
Add to Favorites lets you mark commonly-used dashboards as
favorites and quickly find them in a subsequent work session. This menu item is only
available after you first saved your dashboard.
Set as Homepage lets you change your home screen to the
current dashboard. This menu item is only available after you saved your
dashboard.
Export allows you to export all of the dashboard elements.
This menu item is only available after you saved your dashboard.
Download as... provides you with options to save your
dashboards as images (in png format) and as PDF files.
Show Usage Info provides you with profile data.
New Dashboard lets you create a new dashboard.
Delete Dashboard lets you remove the current dashboard.
The workspace selector allows you to assign your dashboard to a different workspace.
Dashboards can belong to public, private, or a custom workspace, but they can only exist
in one workspace at any time.
Visual preview area🔗
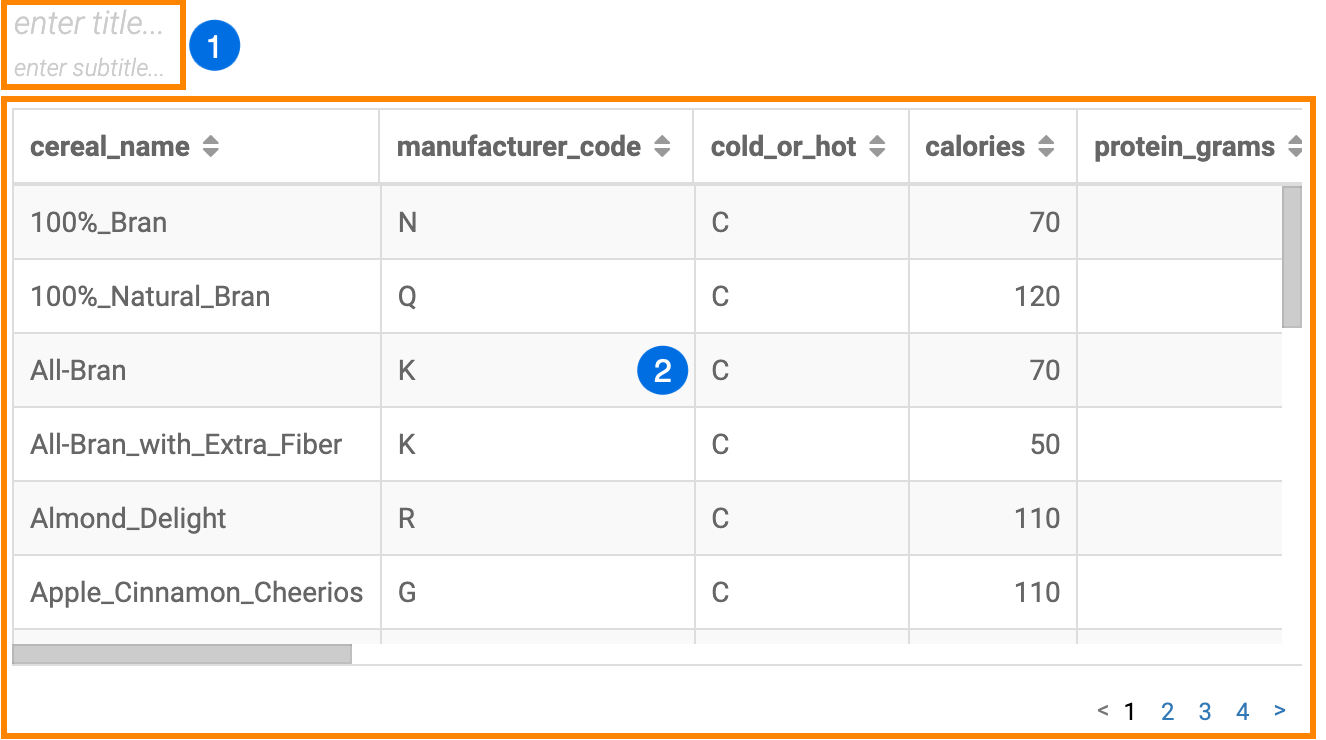
The visual preview area shows the actual visual you have added to your dashboard. When you
start a new dashboard and add your first visual, the default table type is shown listing all
fields in the selected dataset. The preview area also contains the title and subtitle of the
visual.
The title area contains two editable fields where you can add the title and subtitle of
your choice. Both are empty when you create a new dashboard.
enter title...
enter subtitle...
The default table visual is based on the dataset selected.
Visual Builder side menu bar🔗
The dashboard menu selector enables you to choose between
different menus within the Dashboard Designer.
Visuals
Filters
Settings
Style
For more information about the dashboard menu options, see the Dashboard
Designer.
The visual menu selector enables you to choose between different
menus within the Visual Builder. You can minimize this side menu to
see the full dashboard preview area by clicking the menu icon again.
Build
Settings
Style
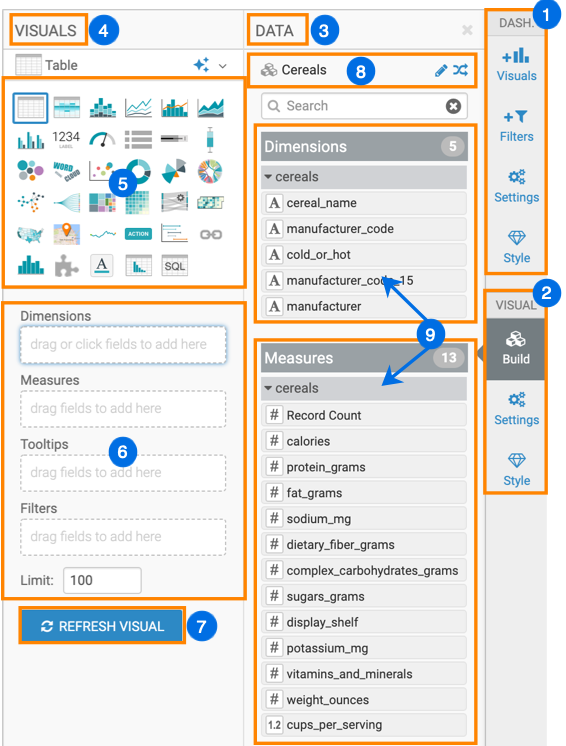
The DATA menu provides you access to the selected dataset and its
fields.
The VISUALS menu provides you with options to define what data is
appears in your visual and how it is displayed.
The Visual Type Catalog menu shows the standard visual types. You
can switch between visual types by selecting a different visual type in this menu. For
more information, see the Visual Type Catalog.
Shelves of the visual specify the fields and segments that
provide the data to the visual. Different visual types require specific information and
have somewhat different shelves.
The table visual has the following shelves:
Dimensions
Measures
Filters
Tooltips
Limit
The shelves of the bars visual are:
X Axis,
Y Axis
Colors
Tooltips
Drill
Labels
Filters
You can populate the shelves by dragging Dimensions
and Measures fields from the DATA menu.
When a shelf is active (selected), you can add multiple fields simply by clicking each
of them in the DATA menu.
If you click the REFRESH VISUAL button after changing the visual
type or the contents of the shelves, the visual is re-drawn.
The name of the Dataset is shown at the top of the
DATA menu. You can click the [arrows] icon
to change the dataset of the visual, or click the [pencil] icon to
open the dataset definition in a new browser tab and make any necessary changes that are
immediately reflected in the options for the visual.
Dimensions and Measures list all fields of
the selected dataset. You can use these to populate the shelves of the visuals. If the
dataset models a join of two or more tables, the fields are grouped with their source data
table.