Using the cumulative option
-
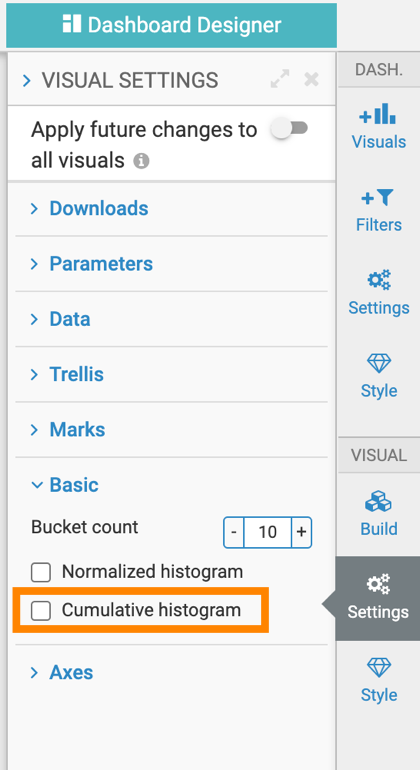
Under Basic, select the Cumulative
histogram option.
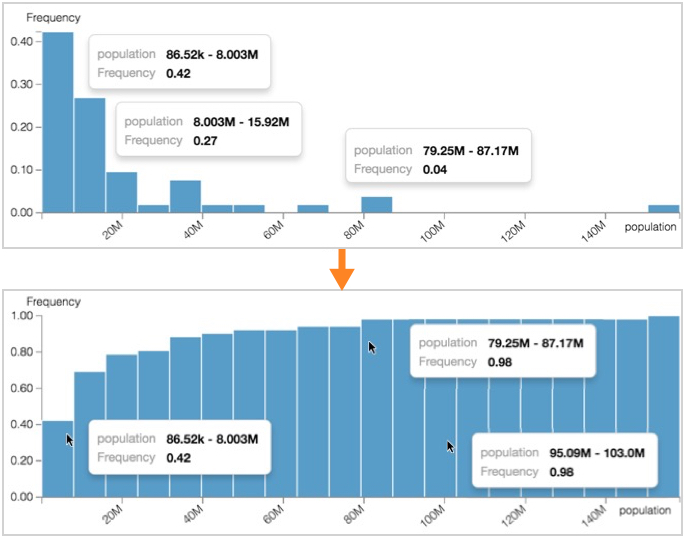
You can see that the difference in the vertical axes between the upper and the lower images; in the lower image, the accumulated values approach 1 on the right side of the graph.