Showing normalized histograms
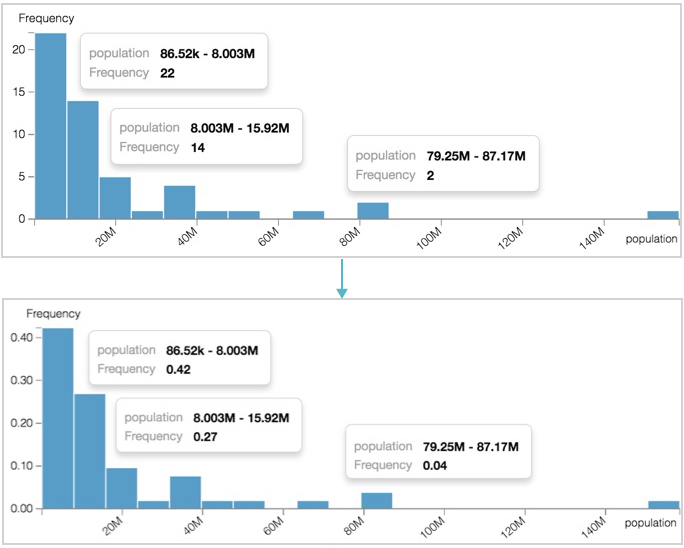
To report the histogram as a percentage of a whole, the histogram count is normalized to add up to 1, and then the bars represent the proportionate frequency.
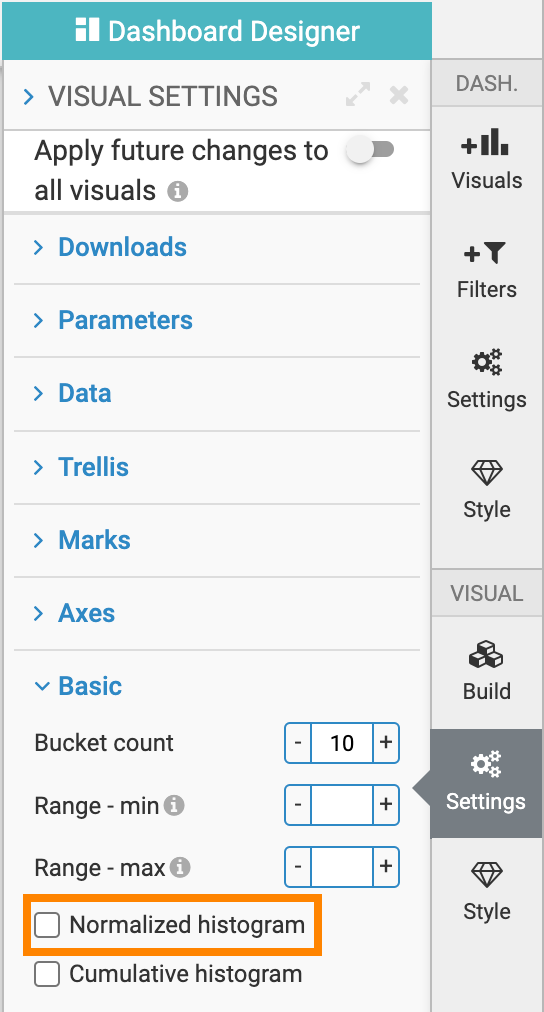
To normalize a histogram, click Settings in the VISUAL menu, open the Basic section, and select the Normalized histogram option.
The following image shows the two versions of the histogram. You can see that the change appears in the vertical axis and the tooltip, where frequency is reported as a number of incidents on the upper graph, and as a percentage on the lower graph.