In Cloudera Data Visualization, you can use extension visuals to add supporting
textual, image, or behavioral aspects to your dashboard.
The following steps demonstrate how to create a simple extension visual with text content
and minor HTML formatting.
Start a new visual based on the US State Populations Over Time dataset.
For instructions, see Creating a visual.
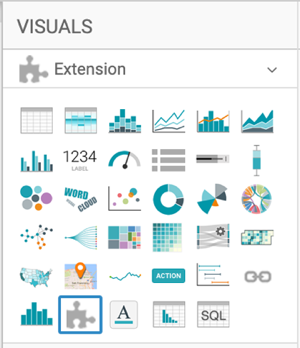
Select Extension in the VISUALS
menu.
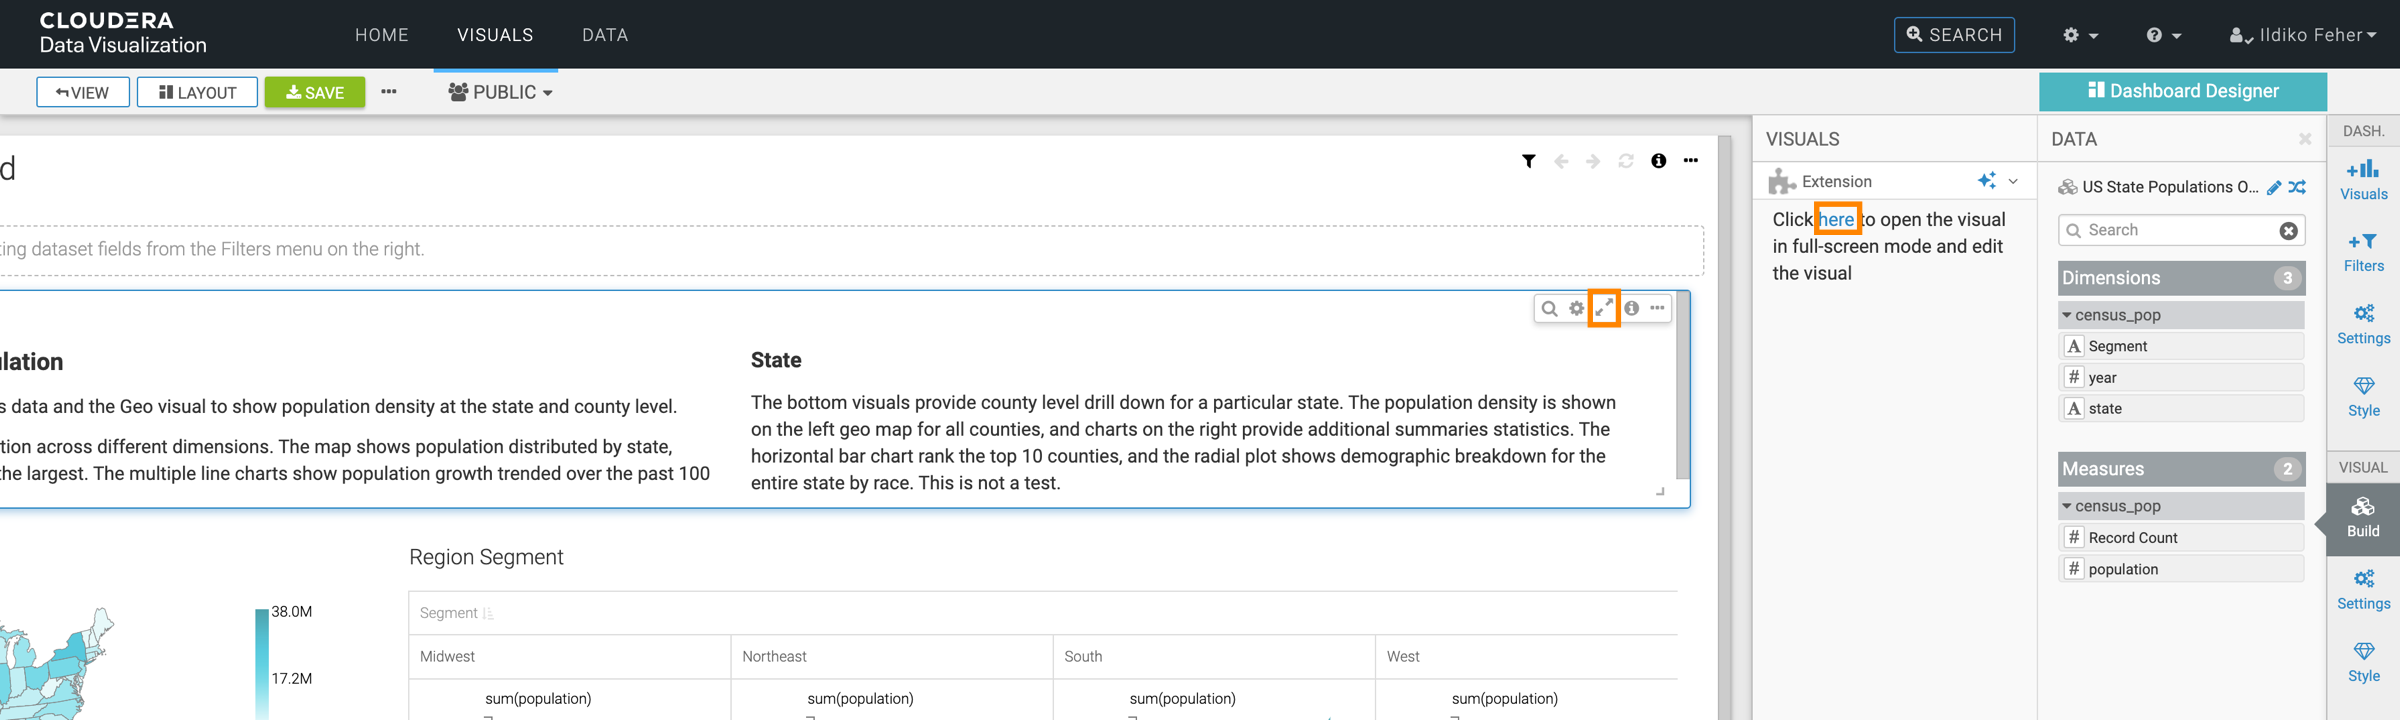
The shelves of the have visual changed. This visual type has a single text box for
entering and editing text or markup.
Click the (expand) icon or the link in the Dashboard
Designer to open the HTML editor.
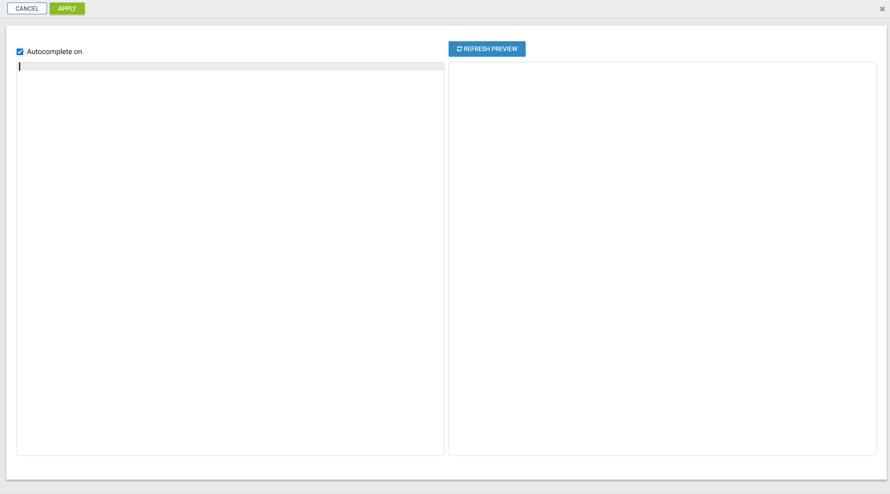
The editor modal window has two columns: one for code and the other one for
preview.
Paste a code block in the text box for code.
In this example, the following code block is used:
<h1>2010 United States Census</h1>
<p>From Wikipedia, the free encyclopedia</p>
<h2>General information</h2>
<ul>
<li>Country: United States</li>
<li>Date taken: April 1, 2010</li>
<li>Total population: 308,745,538</li>
<li>Percent change: Increase 9.7%</li>
<li>Most populous state: California (37,253,956)</li>
<li>Least populous state: Wyoming (563,626)</li>
</ul>
<p>The 2010 United States Census, known as "Census 2010", is the twenty-third
and most recent United States national census. National Census Day, the reference
day used for the census, was April 1, 2010. As part of a drive to increase the
count's accuracy, 635,000 temporary enumerators were hired. The population of
the United States was counted as 308,745,538, a 9.7% increase from the 2000 Census.</p>
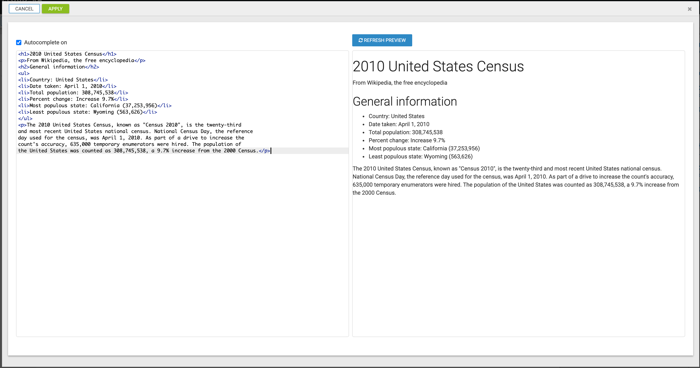
Click REFRESH PREVIEW to view the changes in the preview
column.
The formatted text appears in the preview area of the HTML editor. You can make further
edits to the HTML code and check the changes by refreshing the preview again.
If you do not need the autocomplete function, uncheck the Autocomplete
on option.
Click APPLY to save the changes.
If you do not want to apply your changes, click CANCEL or just
close the modal window.
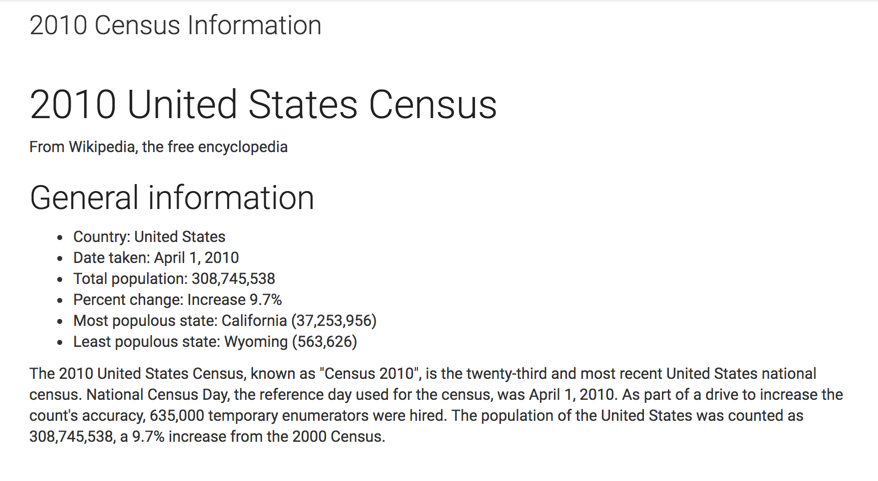
Change the title to 2010 Census Information.
[Optional] You can also add a brief description of the visual as a subtitle below the
title of the visualization.
Click SAVE at the top left corner of the Dashboard
Designer.
Your visual should look something like this:
For more sophisticated uses of the Extension visual, see Examples of extensions.
We want your opinion
How can we improve this page?
What kind of feedback do you have?
This site uses cookies and related technologies, as described in our privacy policy, for purposes that may include site operation, analytics, enhanced user experience, or advertising. You may choose to consent to our use of these technologies, or