WebServer Log
Logs and Usage is a powerful monitoring interface that can help you better understand how users are engaging with Cloudera Data Visualization in your organization. The different tabs provide you detailed information on various aspects, including user activities, system load, and runtime performance. The WebServer Log tab provides access to the log messages generated by the Cloudera Data Visualization application.
You can use the technical details as a resource for debugging Cloudera Data Visualization issues or download the log files and share them with Cloudera Support.

-
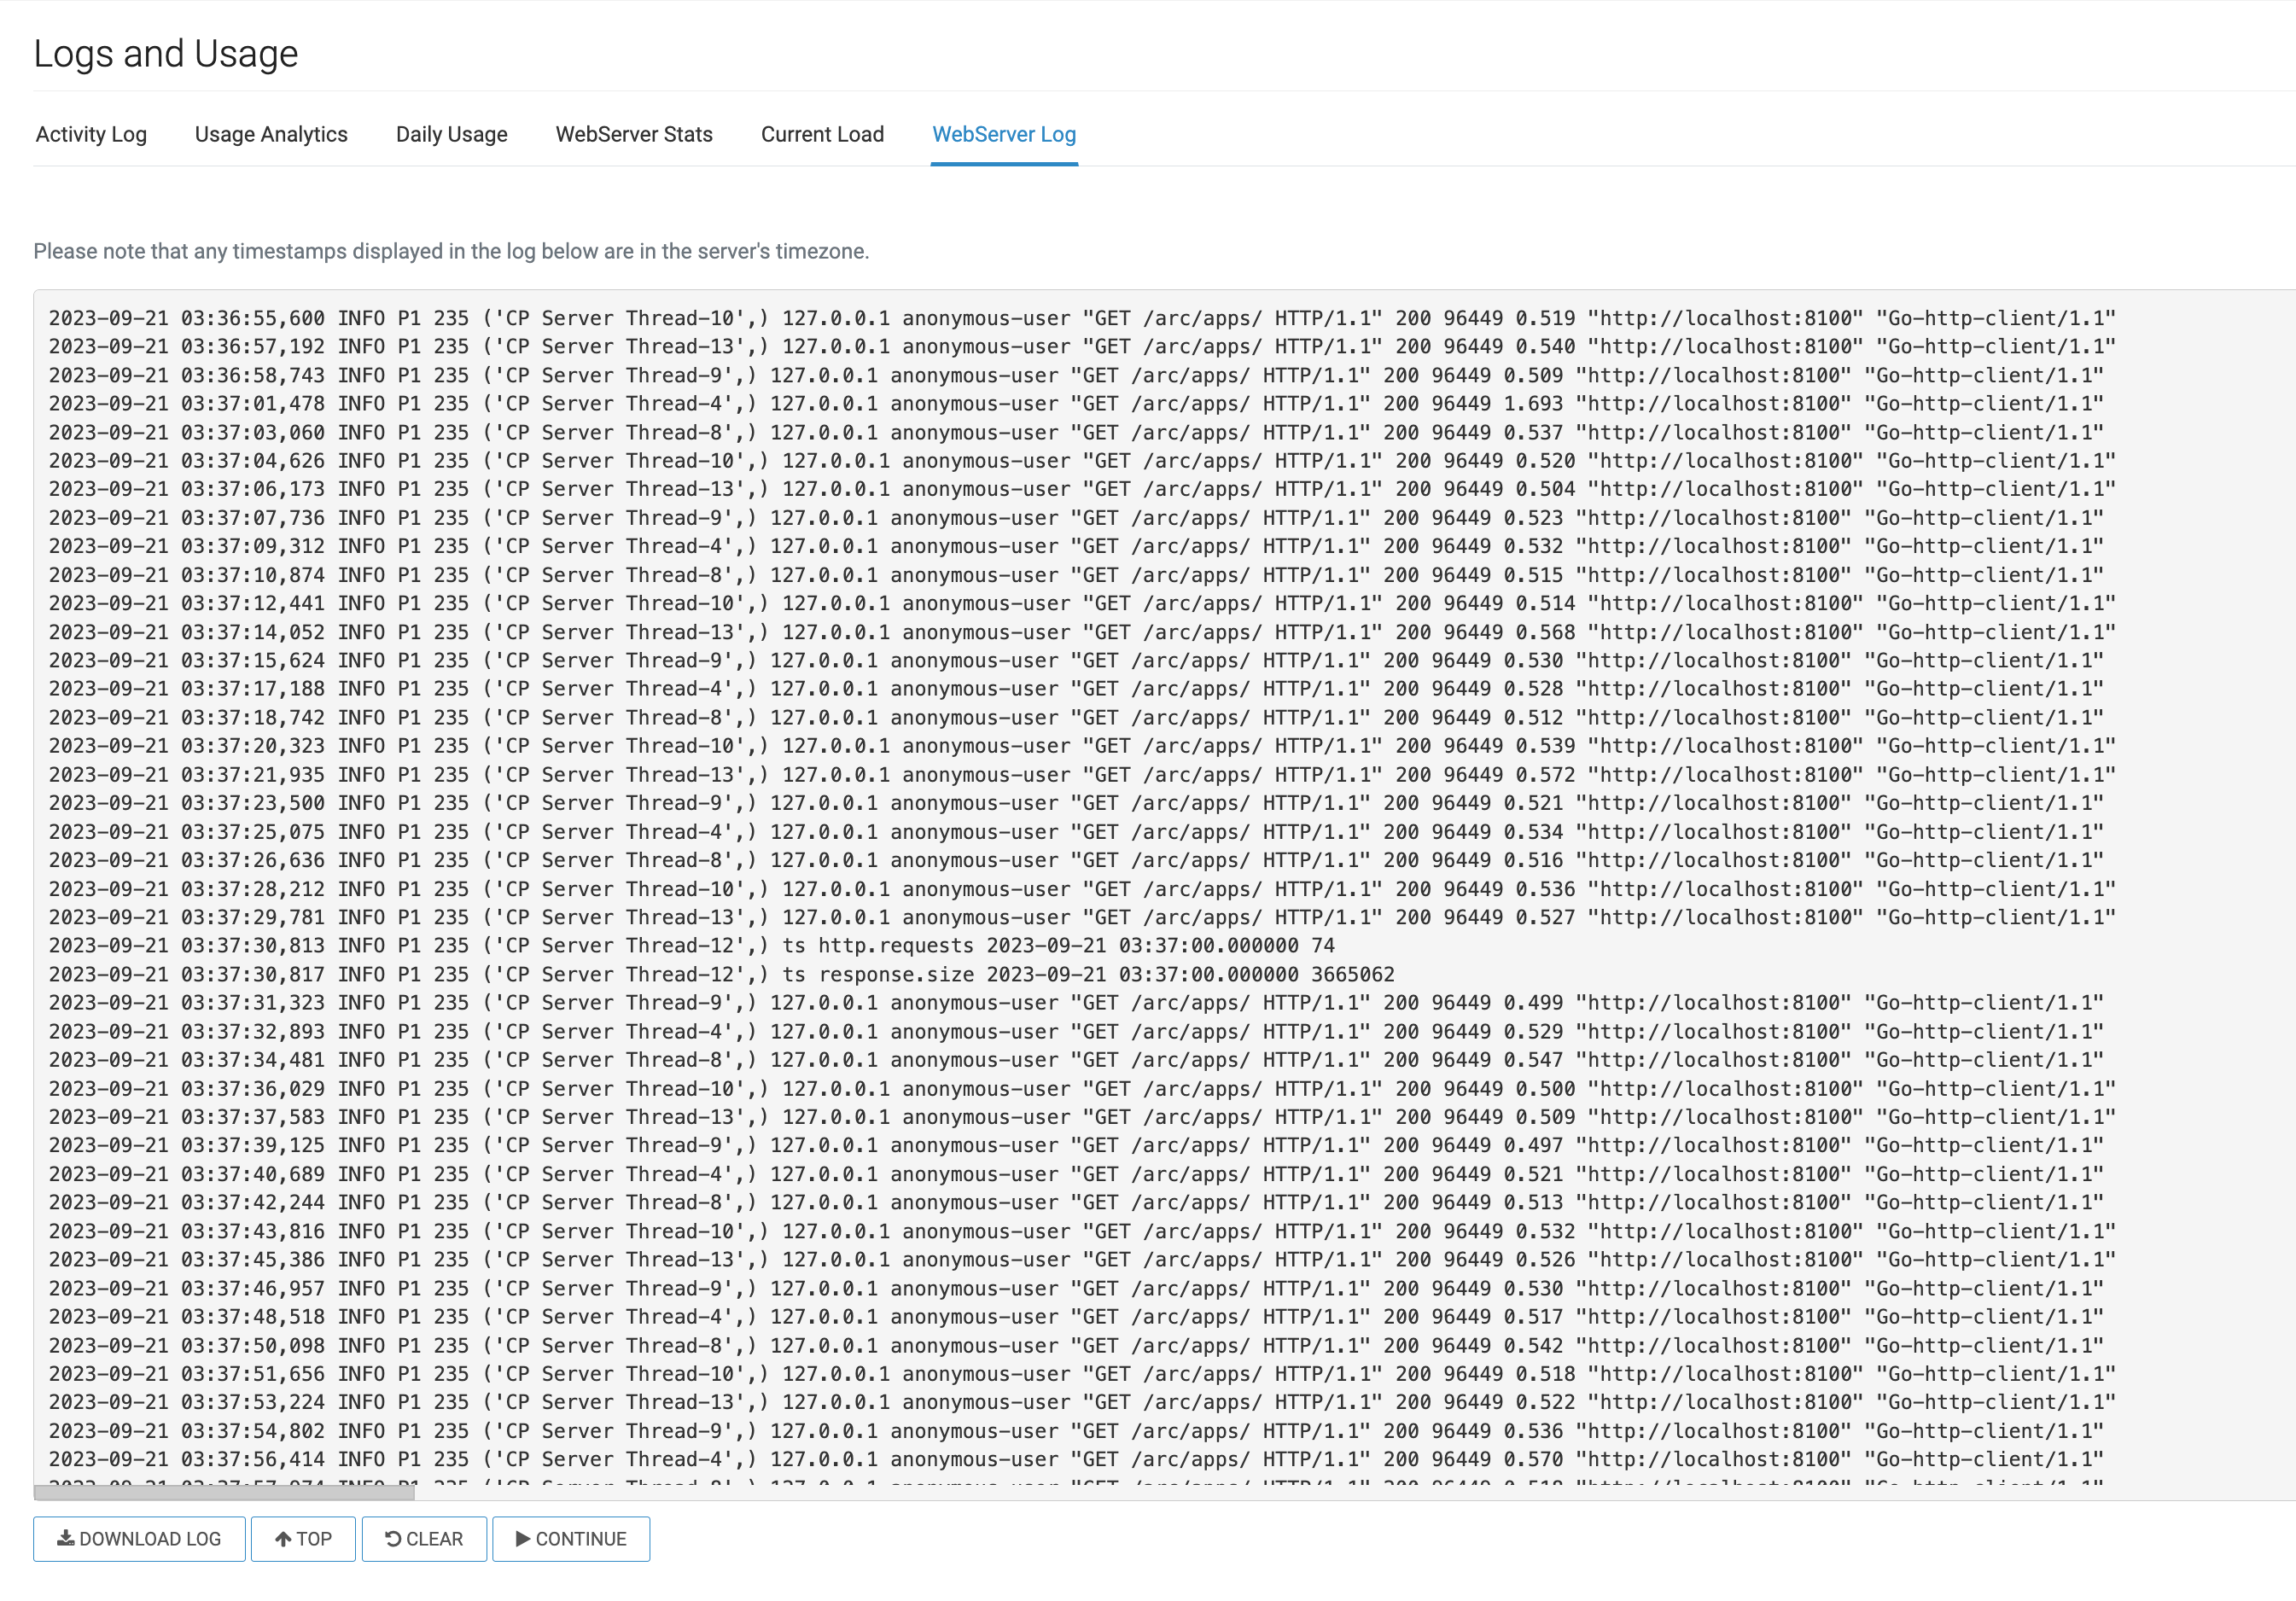
WebServer Activity log window
The activity log is presented as a flat file, featuring timestamps for each event, followed by technical details.
-
DOWNLOAD LOG
You can save log files to your local system. The downloaded files follow the naming convention
arcviz_yyyy_mm_dd_hh_mm_ss.log. For example, a file saved on April 17, 2018 at 1:46:42 P.M. has the namearcviz_2018_04_17_13_46_42.log. -
TOP
You can use this option to swiftly return to the top of the activity list after scrolling down.
-
CLEAR
You can use this option to empty the log window ensuring a clean slate for new log data.
-
PAUSE/CONTINUE
You can use this option to temporarily suspend/resume log reporting.


