Managing dashboard site settings
Cloudera Data Visualization is highly configurable, with many site-wide settings. You can turn specific dashboard related features on and off and adjust various settings for visuals, dashboards, and snapshots.
-
Click the
 icon on the main navigation bar to open the
Administration menu and select Site
Settings.
icon on the main navigation bar to open the
Administration menu and select Site
Settings.
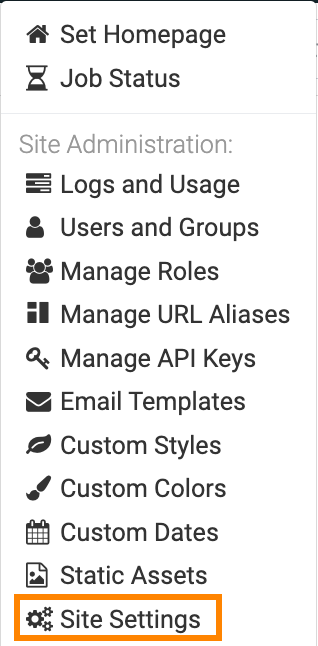
The Site Settings interface opens on the Data page.
-
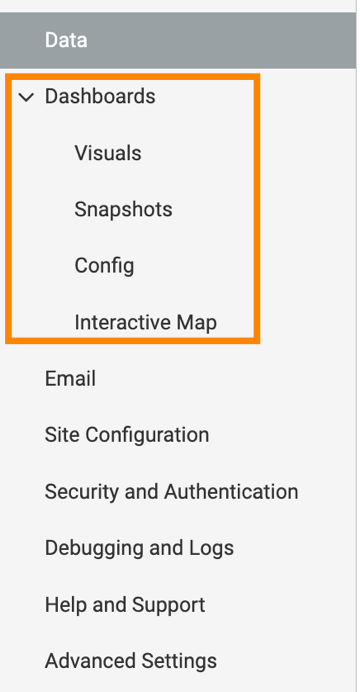
Open the Dashboards menu from the left navigation and select one of
the options available.
Visuals
You can enable various advanced options for visuals.
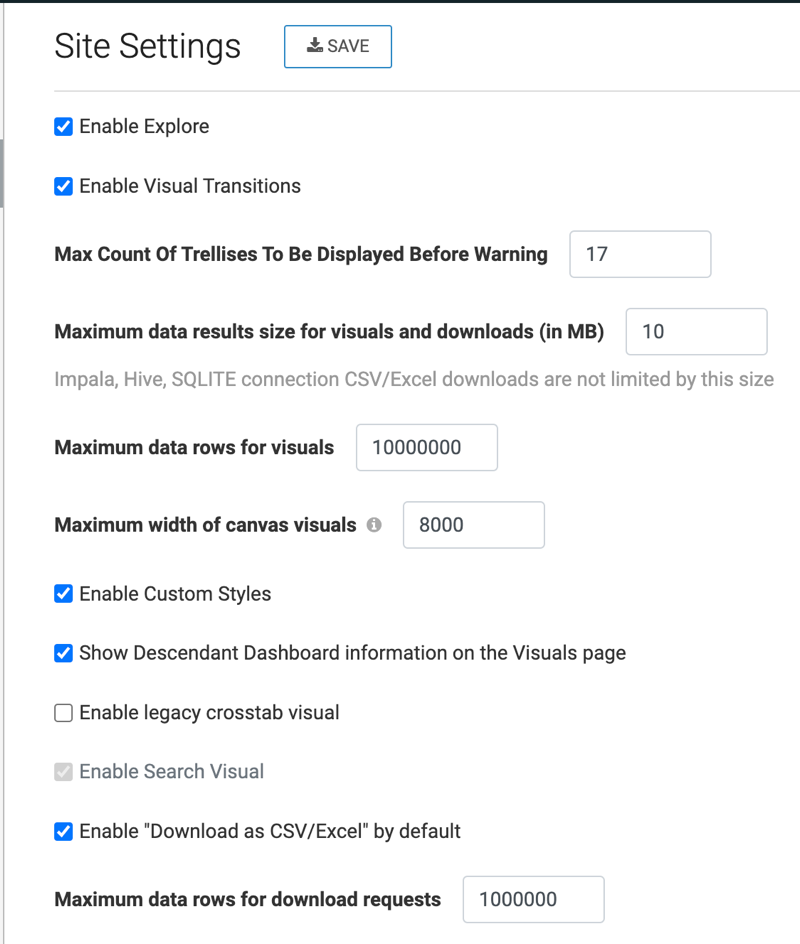
Enable explore
You can use the explore function to find the best visualization for your data request. It suggests new visual types and options based on the information you already use in existing visuals. For more information, see Exploring visual options.
To enable this function, select the Enable Explore option under in the site settings.
Enable visual transitions
You can use transitions to animate visuals during loading and refresh operations. The visual types that use visual transitions include bars, lines, combo, area, scatter, grouped bar, histogram, sparklines, pie, packed bubbles, and correlation heat map.
To enable the transition function, select the Enable Visual Transitions option under in the site settings.
Set maximum count of trellises to be displayed before warning
To adjust the maximum count of trellises, select the appropriate value for Max Count Of Trellises To Be Displayed Before Warning under Visuals.
Set maximum data results size for visuals and downloads
To adjust the maximum data results size, enter a value in the Maximum data results size for visuals and downloads (in MB) text box under .
Set maximum data rows for visuals
You can provide an upper limit for the number of rows rendered in a visual request. Sometimes an inexperienced or malicious user can create a visual requesting billions of rows. This may result in excessive resource consumption at the server level and the result might be too large to render in the client browser.
To avoid this scenario and provide an upper limit on the number of rows rendered, enter a value in the Maximum data rows for visuals text box under in the site settings.
At the individual visual level, the setting in the Maximum number of rows to fetch option in the Data menu of the Visual Designer overrides this default behaviour.
At the site level, the setting in the Maximum data rows for visuals option overrides the setting in the Maximum number of rows to fetch option.
Set maximum width of canvas visuals
Cloudera recommends that you designate a reasonable maximum width for canvas visuals considering performance reasons. Overly wide visuals that display streaming data may cause the Internet browser to crash.
To set the maximum width value, enter a value in the Maximum width of canvas visuals text box under in the site settings.
Enable custom styles
To enable the feature, check the Enable Custom Styles option under in the site settings.
Show descendant dashboard information
You can choose to show descendant dashboard information on the Visuals page.
To enable the feature, check the Show Descendant Dashboard information on the Visuals page option under in the site settings.
Enable legacy crosstab visual
You can make the legacy crosstab visual type available to users.
To enable the feature, check the Enable legacy crosstab visual option under in the site settings.
Enable the search visual
- Enable Search Visual
- You can find it under
- Enable Search in Menu Bar
- You can find it under Site Configuration.
Set CSV/Excel download as default
In Cloudera Data Visualization, you can download data in a visual in CSV or Excel format.
To make this download option default, check the Enable "Download as CSV/Excel" by default option under .
Set maximum data rows for download requests
Sometimes an inexperienced or malicious user can download a large number of rows. This may result in excessive resource consumption at the server level.
To avoid this scenario and provide an upper limit on the number of rows downloaded in a CSV file, enter a value in the Maximum data rows for download requests text box under .
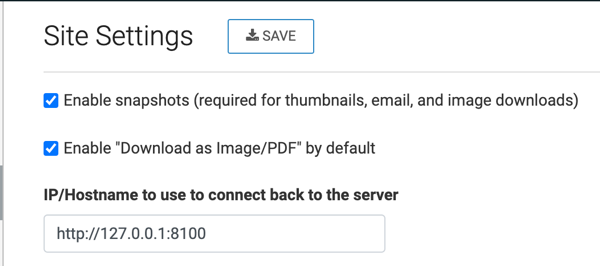
Snapshots
The group of snapshot settings enables you to take snapshots of your actual visuals and dashboards, which you can then download as PNG files.
Snapshots replace the standard thumbnails that appear in the Visuals interface with miniaturized versions of the visual or dashboard. This customization makes it very easy to locate the visuals and dashboards you want to use.
You can configure the following settings:
- Check Enable snapshots (required for thumbnails, email, and image downloads).
- Check Enable "Download as Image/PDF" by default
- Set the IP/Hostname to use to connect back to the server. You can use the default value or change it to connect to a different server.
The Site Settings menu is only available to users with administrative privileges.
Config
You can perform the following dashboard configuration actions:
Set default width of dashboards
Set warning that loading dashboards takes too long in view mode
To set the warning, check the Show "This dashboard is still loading data" in view mode option under in the site settings.
Interactive Map
The Site Settings menu is only available to users with administrative privileges.
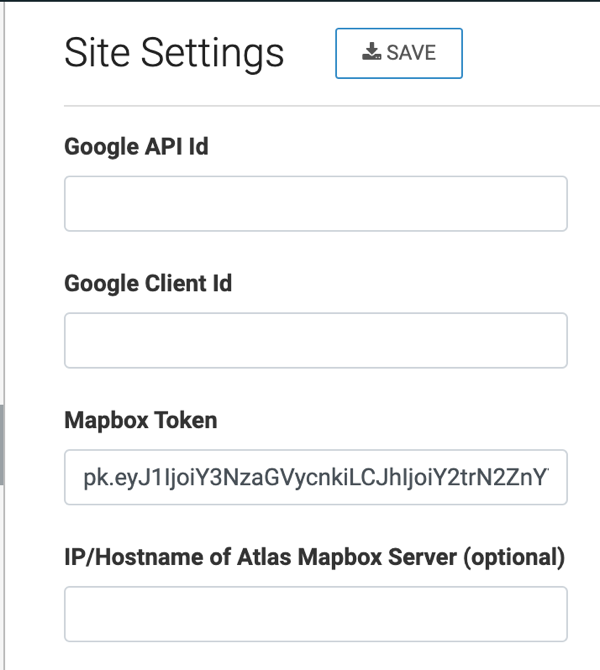
Enable API keys for interactive map visuals
Your organization must obtain its own credentials for Google Maps, either Google API Id or Google Client Id. To obtain Google Maps keys, see Google Maps APIs.
For the Mapbox interface, your organization must get a Mapbox Token and the Mapbox Style ID, specified for each visual in the Settings menu. Cloudera Data Visualization already has a default mapbox token. To obtain new Mapbox tokens and Style IDs, see Mapbox.
Specify atlas mapbox server
You can use a Mapbox server or specify an Atlas Mapbox server at the site level to run Mapbox APIs on your own infrastructure, whether on your own private cloud or on-premises.
To specify an Atlas Mapbox server at the site level, Enter the IP address or hostname of the Atlas Mapbox server in the IP/Hostname of Atlas Mapbox Server (optional) text box.