Opening a dashboard
A Cloudera Data Visualization dashboard is a collection of multiple visuals. You can access existing dashboards on the VISUALS interface and open them in either View or Edit mode. If a dashboard is loading slowly, a notification is displayed. This data load message provides a link to the Profile Data modal for more information on the requests and operations in progress.
View mode
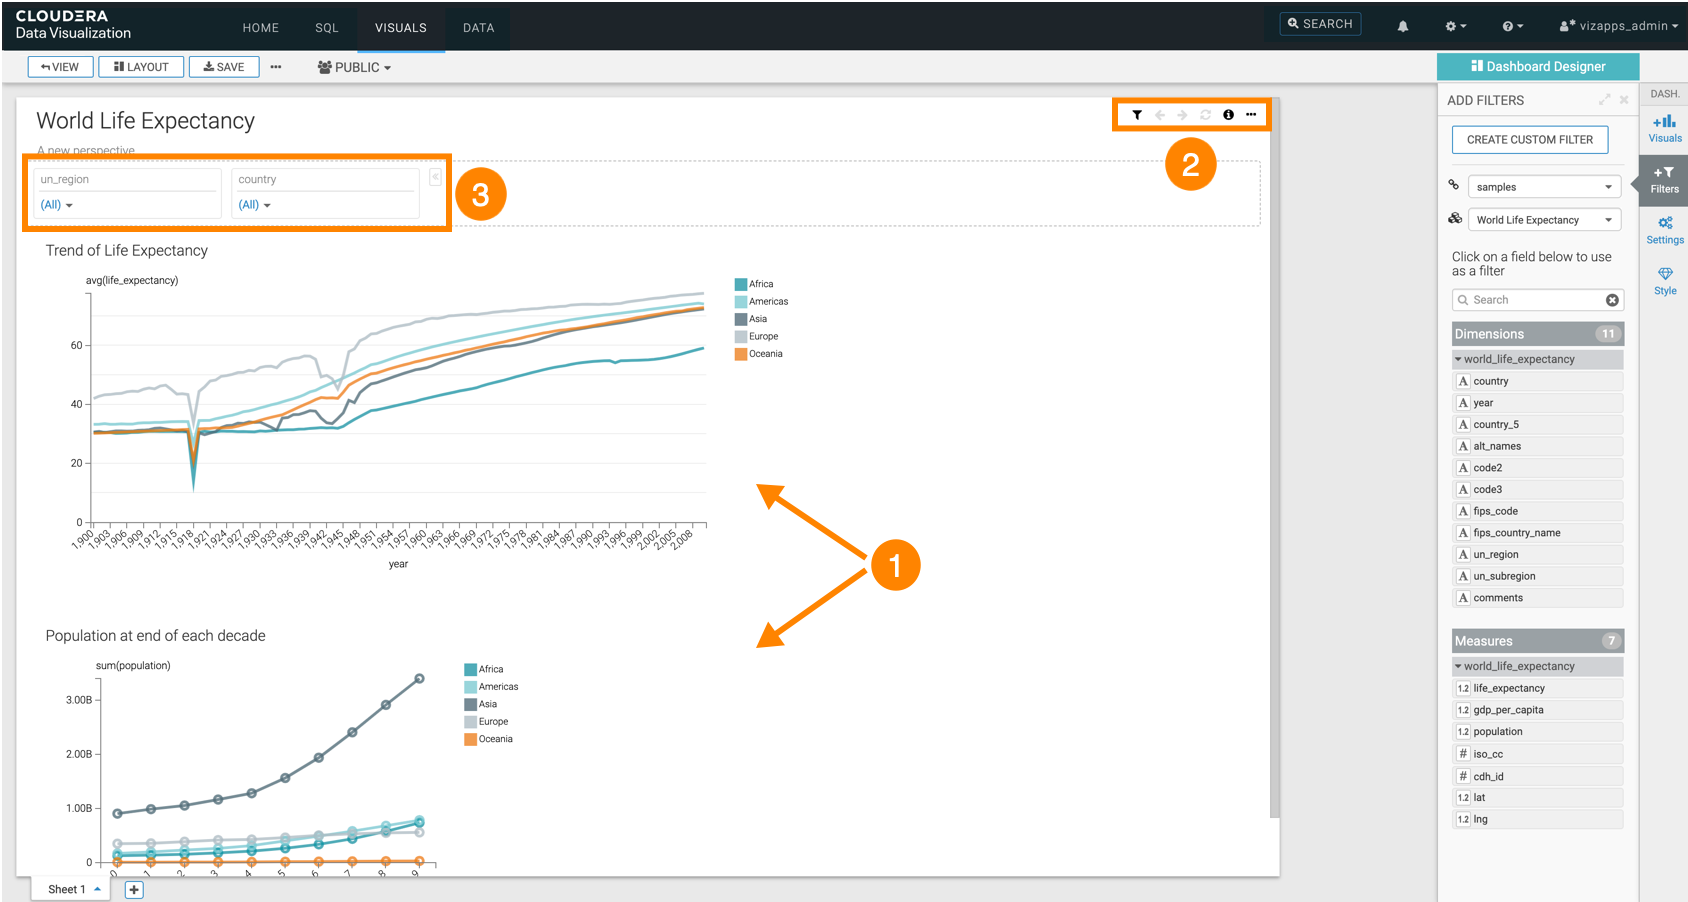
View View mode provides a read-only view of a dashboard and its visuals. Despite being read-only, this mode is dynamic and responsive, which is primarily achieved by filters and dashboard controls.
- Visuals displayed on the dashboard
- Dashboard controls
- Filters (if added)

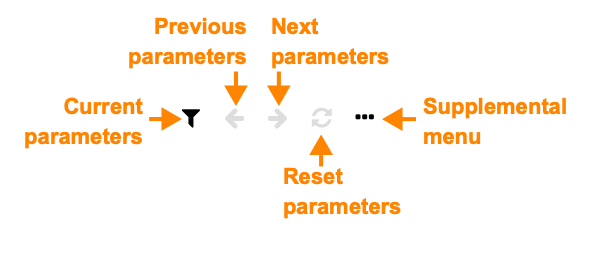
Dashboard controls
- Current Parameters: Shows the current values of dashboard-level filters.
- Previous Parameters (left arrow icon): Navigates backward through filter settings, resetting the filter values to the previous state. Keyboard shortcut: Ctrl/Cmd + B.
- Next Parameters (right arrow icon): Navigates forward through filter settings, advancing the dashboard to the next state (if available). Keyboard shortcut: Ctrl/Cmd + F.
- Reset Parameters (refresh icon): Resets the dashboard to its initial state with the original filter values. To change these initial values, you must edit the dashboard and save the changes. Keyboard shortcut: Ctrl/Cmd + F.
- Supplemental Menu: Provides options to email the current sheet, or to get the full dashboard URL so you can copy it, share it, or create an alias for it.

Edit mode
Edit mode is accessible to the dashboard owner and all users who have been granted access permissions. It allows you to edit the dashboard, including editing existing visuals and adding new ones to the dashboard.
To edit an existing dashboard:
-
Open it in View mode and click EDIT in the top-left corner.
-
On the VISUALS interface, hover over the dashboard tile and click the (pencil) icon in the bottom-right corner.


