Changing line style
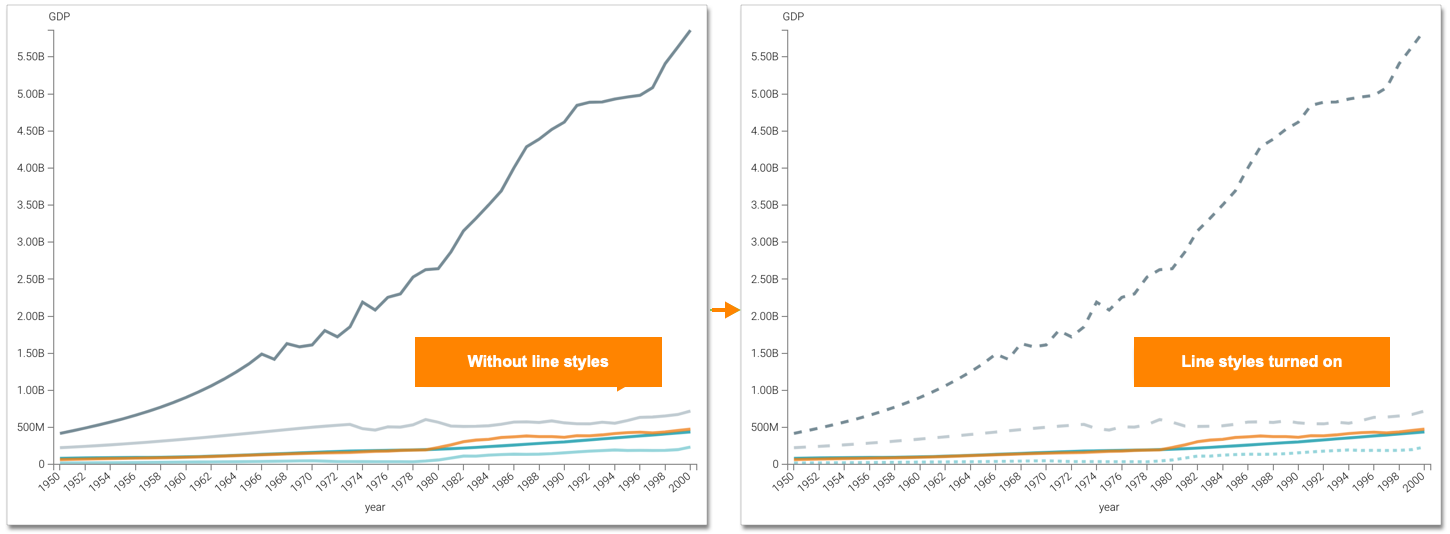
In a line visual, you can display a different line style for each measure in the visual.
To modify each line of a visual to a different style, navigate to the Marks menu, and check the Modify line styles per color option.

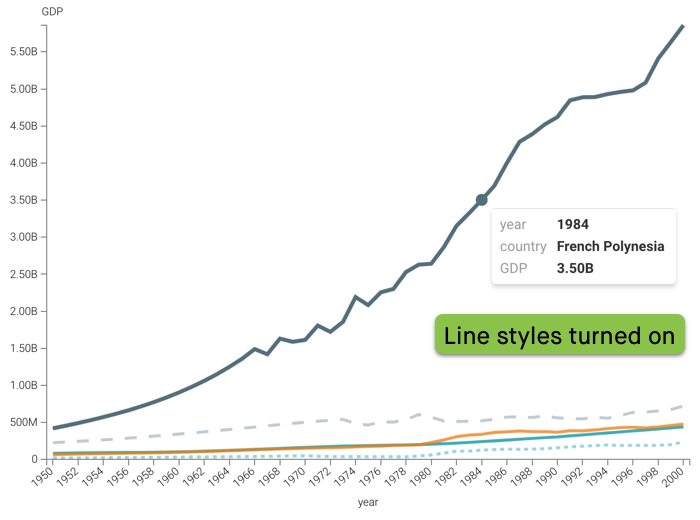
In the following image, notice the different line styles for each measure:
If you hover over a line, the line style changes from a dotted (or dashed) line to a solid line, and the tooltip appears.