Deploying Cloudera Data Visualization in Cloudera Data Warehouse
Learn how to create and launch a Cloudera Data Visualization instance within the Cloudera Data Warehouse data service. You can use Cloudera Data Visualization with Cloudera Data Warehouse in both Cloudera Public Cloud and Cloudera Private Cloud to explore and visualize data stored in database catalogs providing data-driven insights throughout the entire data lifecycle.
If you want to create visuals based data stored in Cloudera Data Warehouse, you have to create a Cloudera Data Visualization instance and connect it to Hive or Impala Virtual Warehouse(s).
- You are logged into the Cloudera web interface and you have opened the Cloudera Data Warehouse service.
- You have DWAdmin role in Cloudera Data Warehouse.
- You have activated your environment.
- You have a Hive/Impala warehouse in running state.
- If you are using Cloudera Data Visualization with Cloudera Data Warehouse in Cloudera Private Cloud:
You have an admin group created in . To log in using LDAP, select the Sync Groups on Login option from , so that the associated groups can be imported when you log in to Cloudera Data Visualization.
-
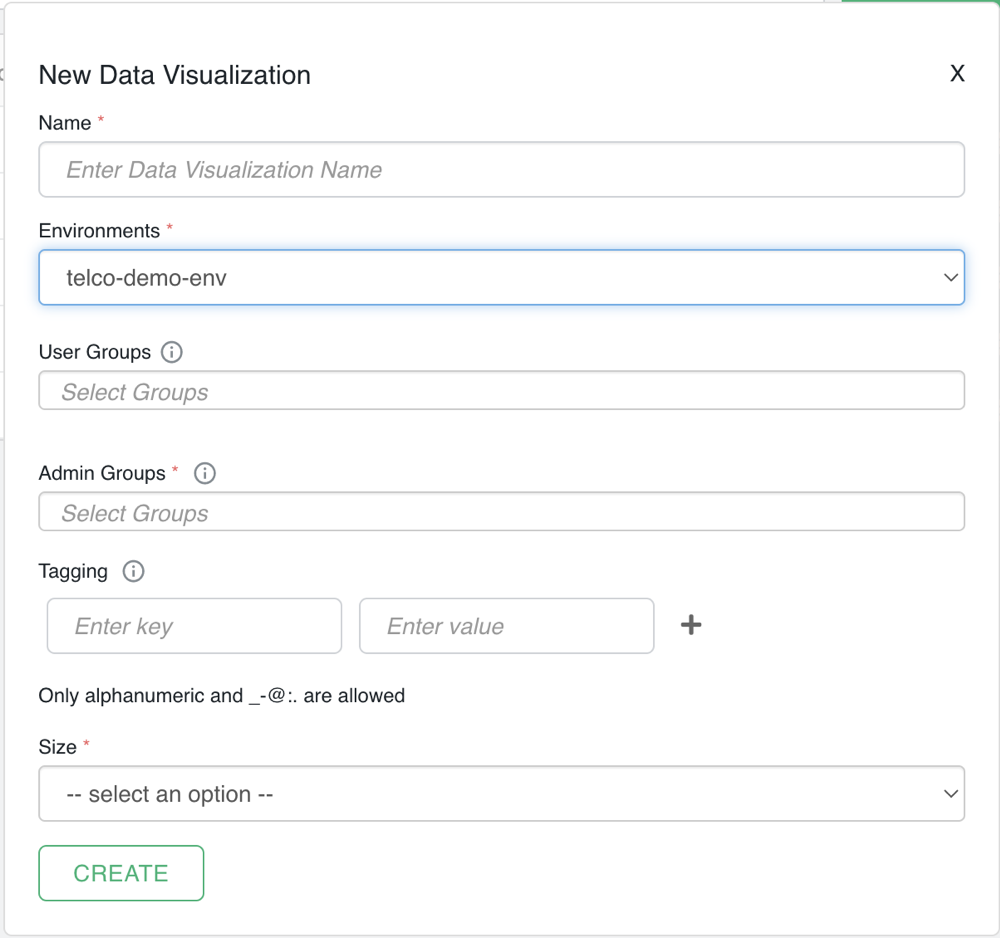
Click ADD NEW to create a new instance.
If you are creating the first Cloudera Data Visualization instance in Cloudera Data Warehouse, click CREATE.
-
Provide the following information in the New Data Visualization
modal window:
Mandatory fields are marked with an asterisk.
-
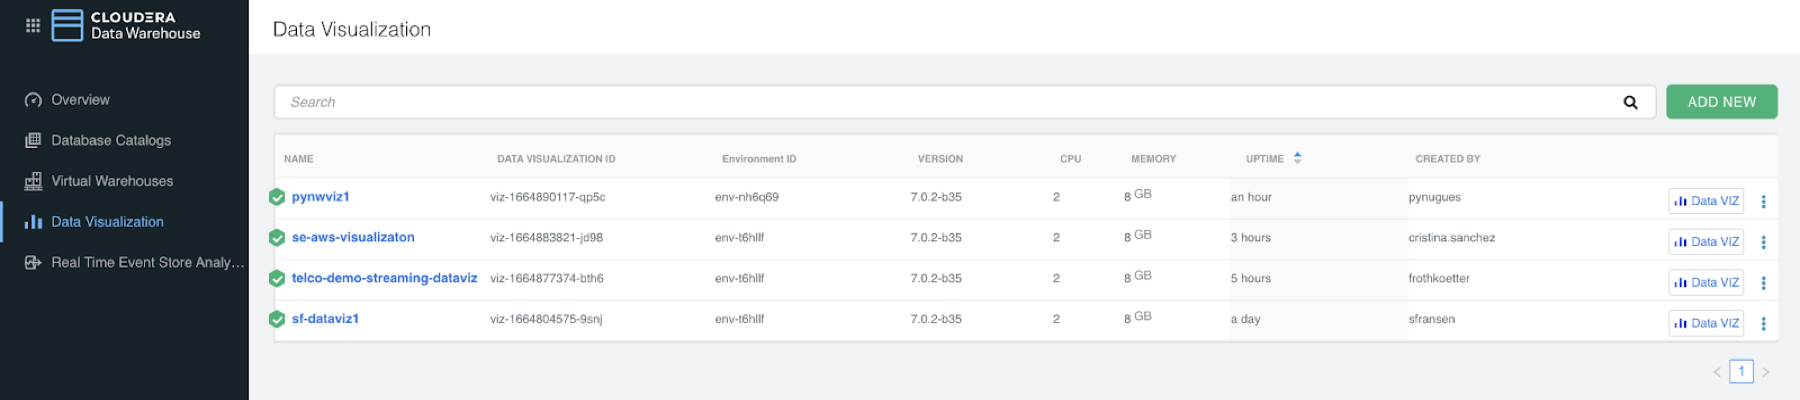
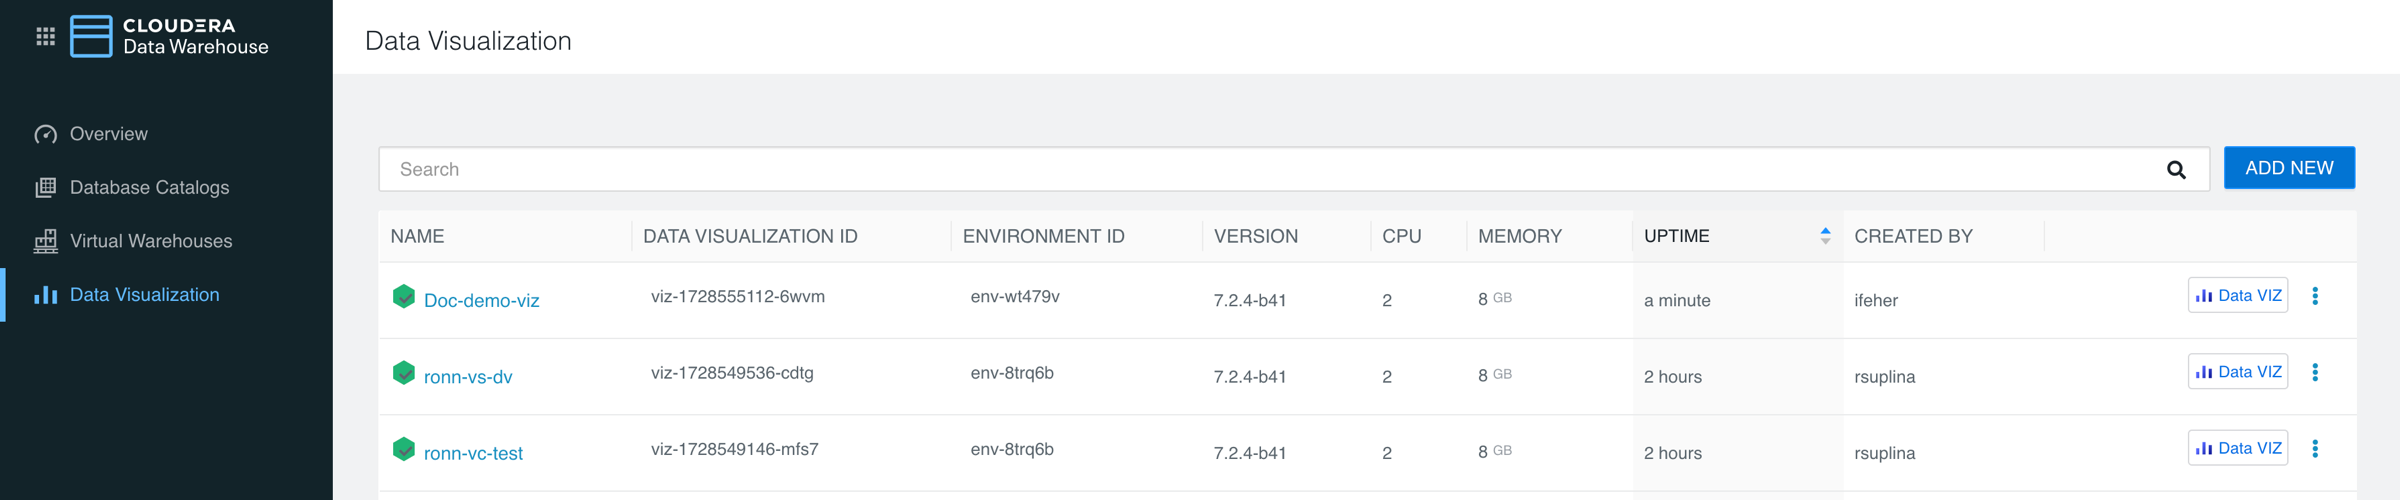
You can find the list of Cloudera Data Visualization instances and environments
appears under the Data Visualization menu that you can open from
the left navigation panel.
-
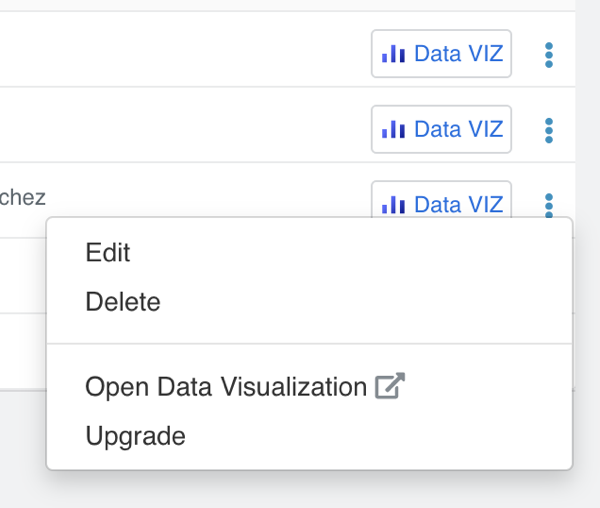
Select one from the list of running Cloudera Data Visualization instances and
click
 to start Cloudera Data Visualization.
Alternatively, you can click the launch/options menu (three dots) at the end of the row and click Open Data Visualization in the pop-up menu.
SSO authentication is enabled by default both in Cloudera Public Cloud and Cloudera Private Cloud. If you are logged in to the Control Plane, you will be logged into Cloudera Data Visualization automatically. If not, log into the Control Plane using your LDAP credentials. Cloudera Data Visualization opens in a new browser tab and you land on the Cloudera Data Visualization homepage, where you can explore sample dashboards and access the in-tool Get Started guide for help.
New users logging in to Cloudera Data Visualization are automatically added to the viz_guest_group group. You can assign the System Admin role to this group to grant new users the permission to create new connections. For more information, see Assigning roles to users.