
Creating control visual
In Cloudera Data Visualization, you can have one (source) visual act as a filter that controls the behavior of the target visual, inside the same application.
-
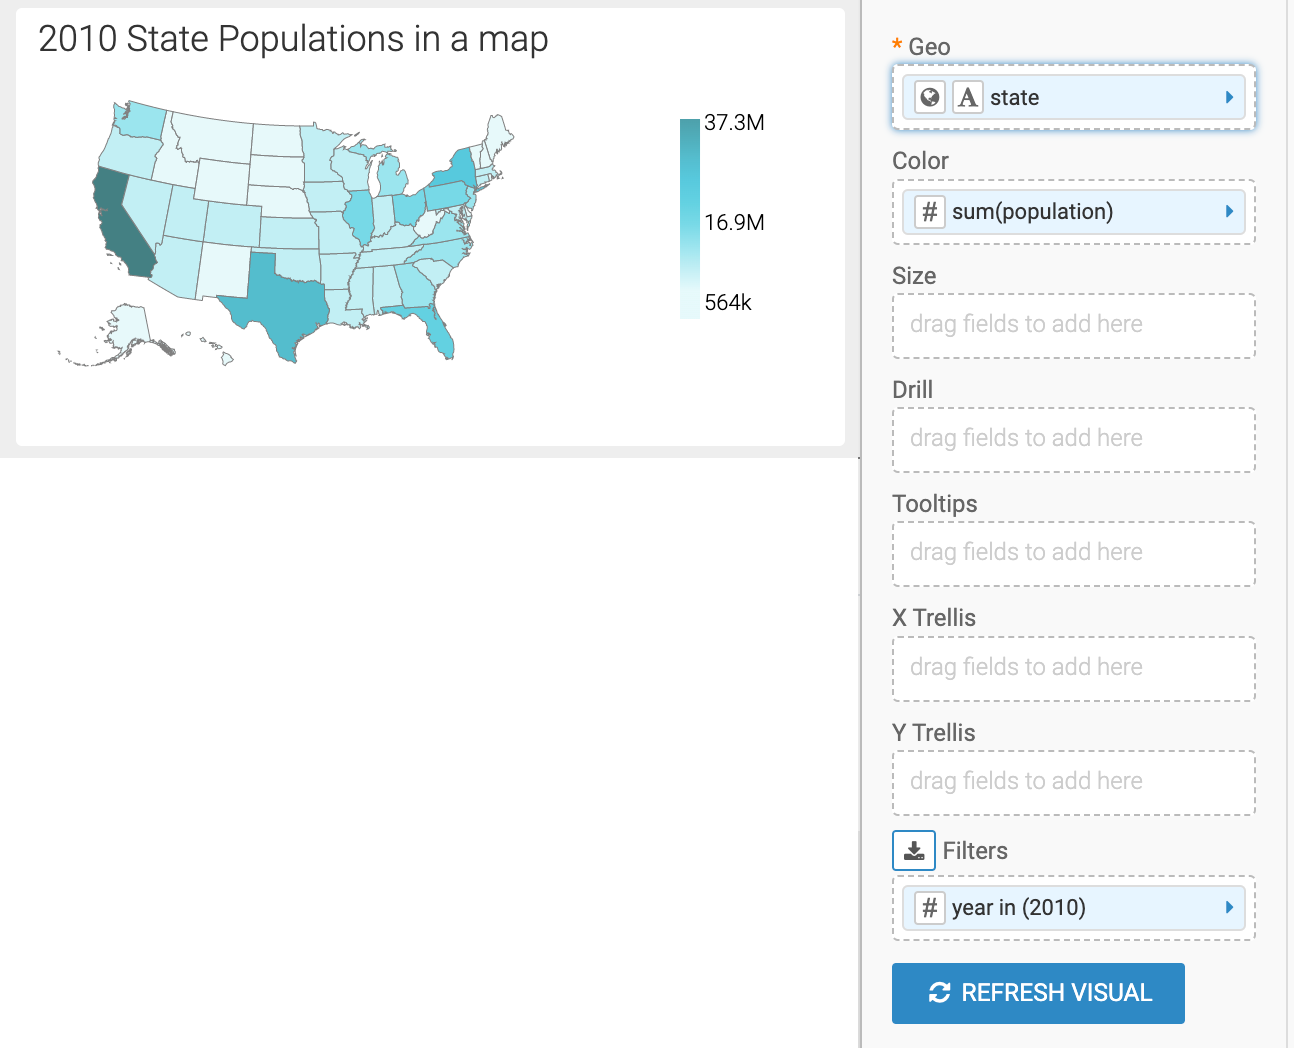
Click REFRESH VISUAL.
In Cloudera Data Visualization, you can have one (source) visual act as a filter that controls the behavior of the target visual, inside the same application.
What kind of feedback do you have?
