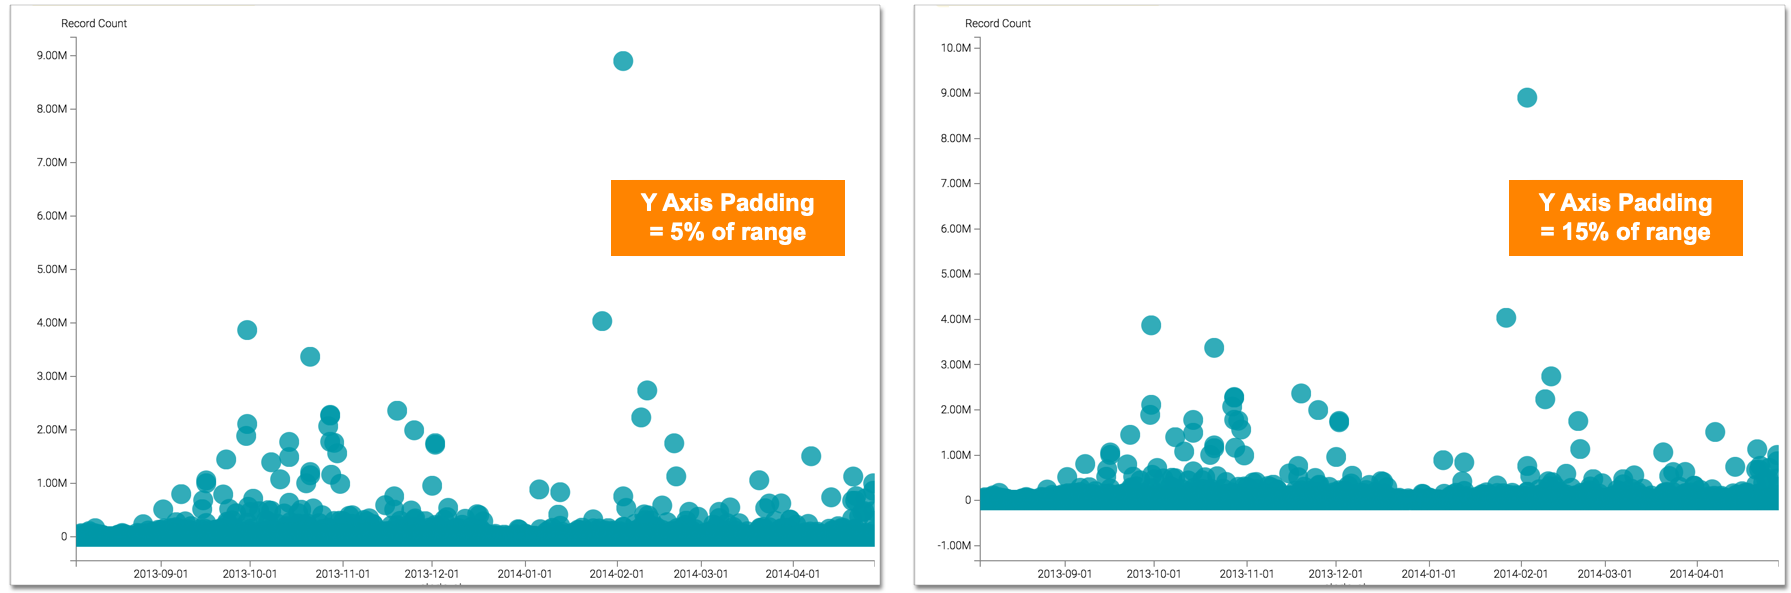
Changing the padding on the Y axis
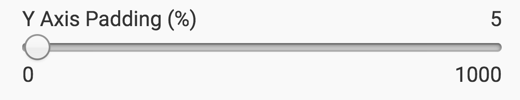
To change the extra space at the top and at the bottom of the plot (Y Axis padding), adjust the value on the selector Y Axis Padding (% of range). The default is 5%, the range is from 0% to 1,000%.
For example, contrast the Y Axis padding of the same graph at 5% and at 15%.