
Highlighting elements by hovering over legend
A visual may become very crowded, making it hard to understand what graphical elements represent. Cloudera Data Visualization makes it easy to find a particular series by making legends not only explanatory, but also interactive.
You can find details of a particular element in the legend by hovering over it.
-
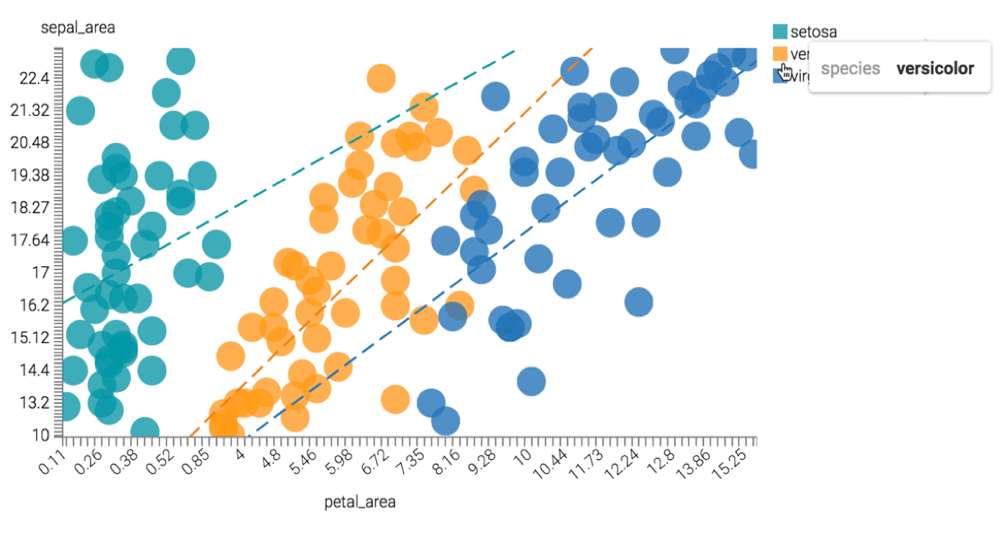
Hover on one of the options in the legend to highlight only the data for that
species.
This example shows versicolor.
This graph is also interactive in Edit mode, inside a dashboard.
