
Using the search visual in a dashboard
After creating a Search visual, it is available for use from the Dashboard page like any other visual.
Before performing this task, you need to create a Search visual. For instructions, see Creating a search visual.
-
Open the dashboard from the Dashboard page.
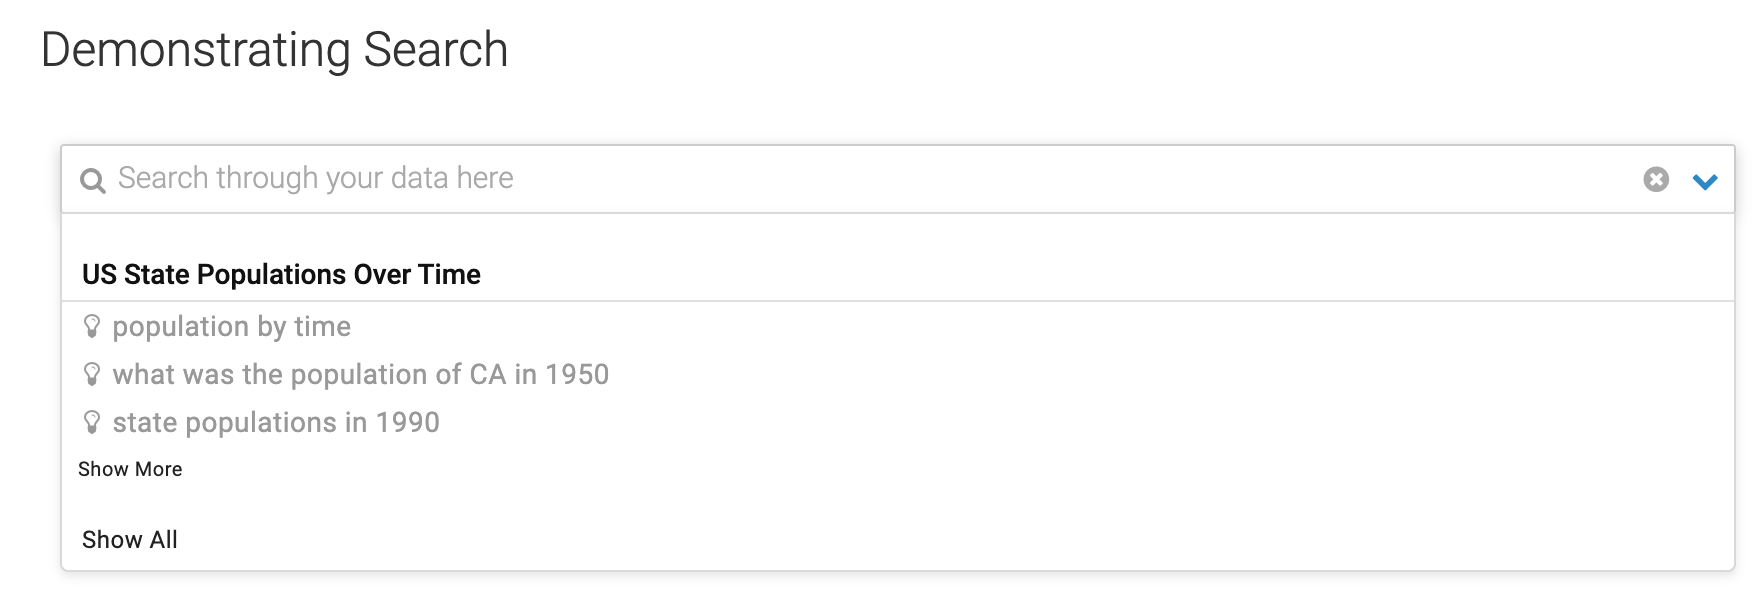
The Search Box visual appears in the dashboard. Its only element is the search box itself.
-
Select a search.
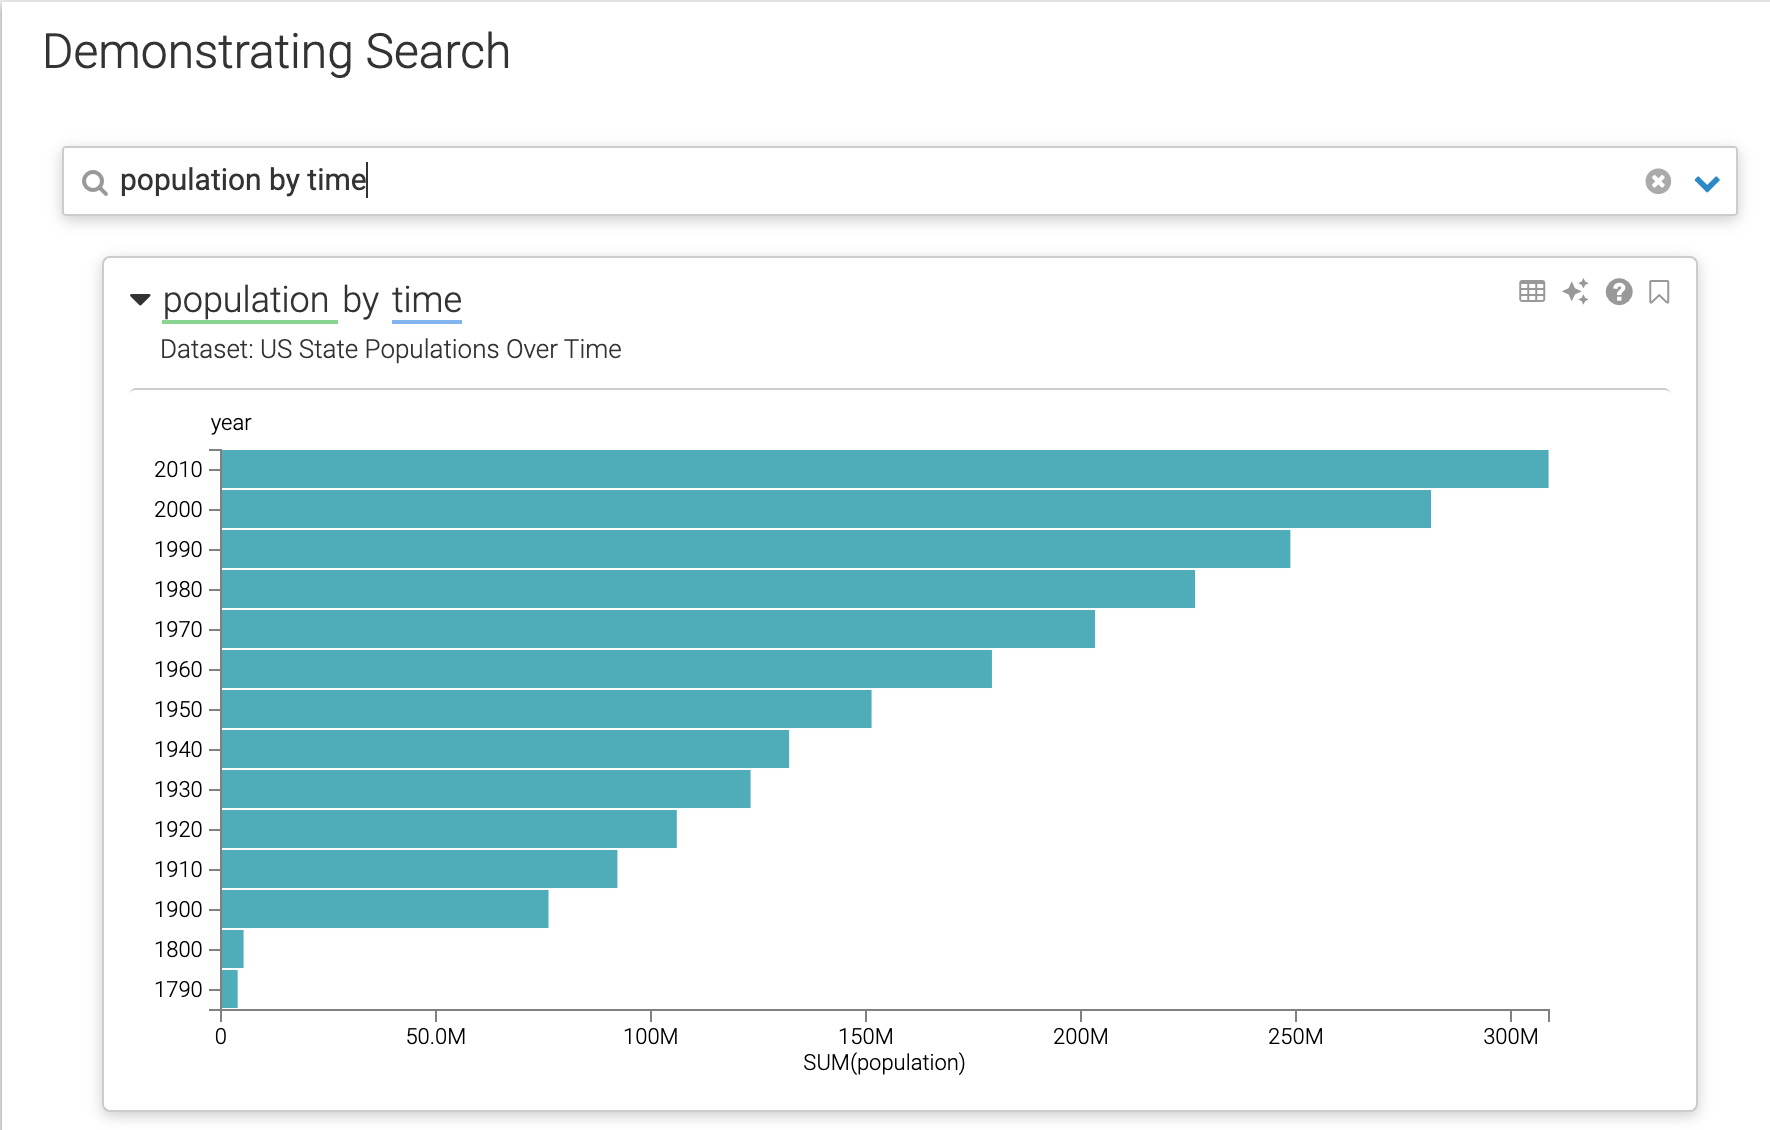
The visual changes. It shows both the search box with the specified search statement and the visual that reports the results of that statement. In the following example, ‘population by time’ is selected.
For more information on the available actions, see Search results.
