
Creating filters to control variable measures
-
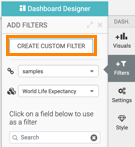
Click CREATE CUSTOM FILTER.
-
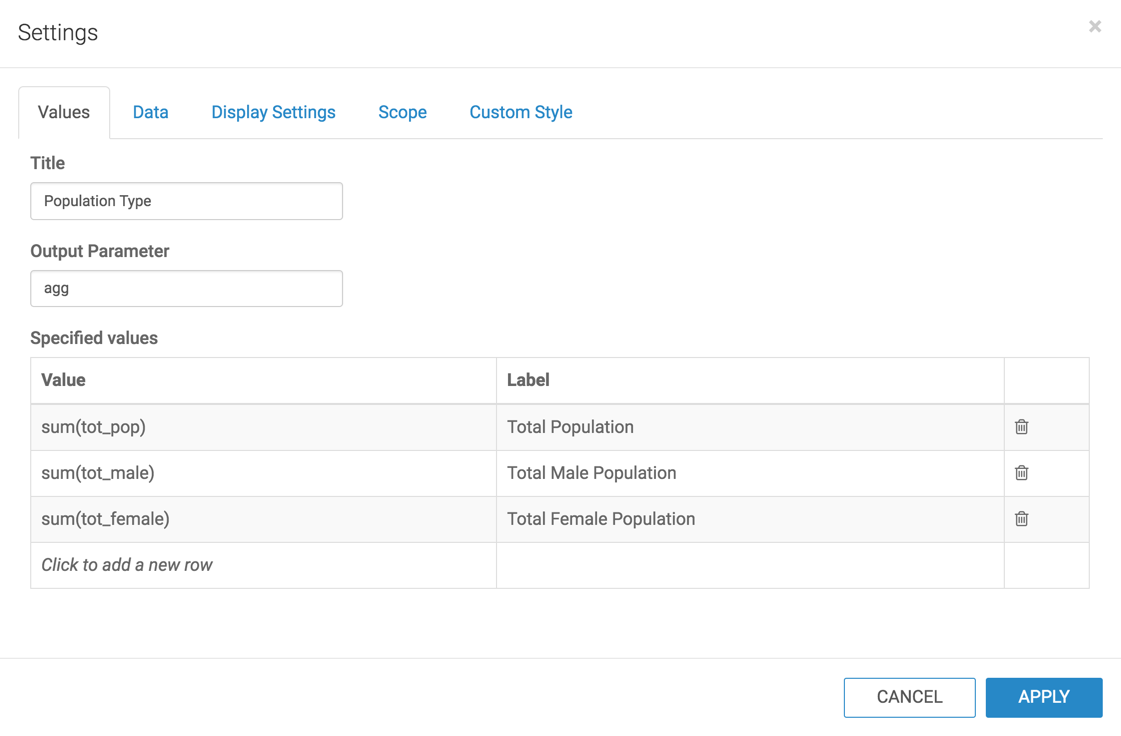
Switch to Values tab and enter the following:
- Under Title, enter Population Type.
- Under Output Parameter, enter agg. Note that this is the parameter from Creating visuals with variable measures.
- Under Specified values, enter the following two rows:
- Value:
sum(tot_pop), Label: Total Population - Value:
sum(tot_male), Label: Total Male Population - Value:
sum(tot_female), Label: Total Female Population
Note that these are the original field names in the source table.
- Value:
-
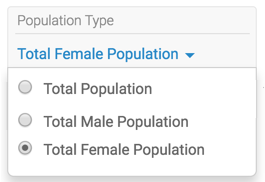
In the Population Type filter, select Total Female
Population.
-
To check the parameters of the dashboard, hover the pointer over the
Filter icon at the top right corner.
They are
agg: sum(tot_female), agg.alias: Total Female Populationanddim: Stname. You can scroll down to see thedim.alias: Stateparameter.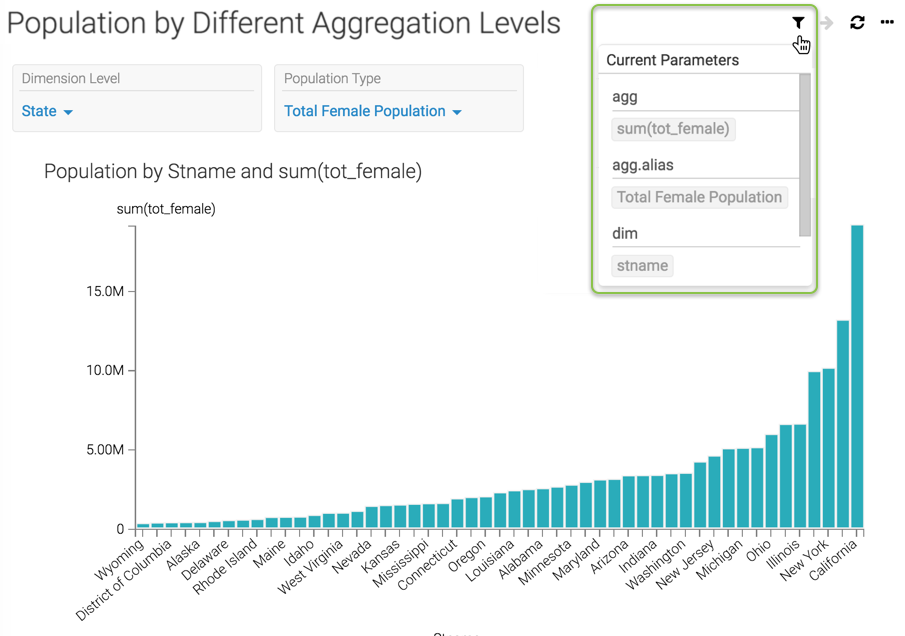
You can now operate the two filters, Dimension Level and Population Type, independently.
You can also navigate between the permutations of filter outputs you create by using filter navigation controls at the top right corner.
