Using quick filters
In Cloudera Data Visualization, the quick date filter enables you to provide a quick selection of date ranges for visualizing your data.
The following steps show you how to use the quick filters option for a date and time filter. The instructions use a calendar heatmap visual as an example.
-
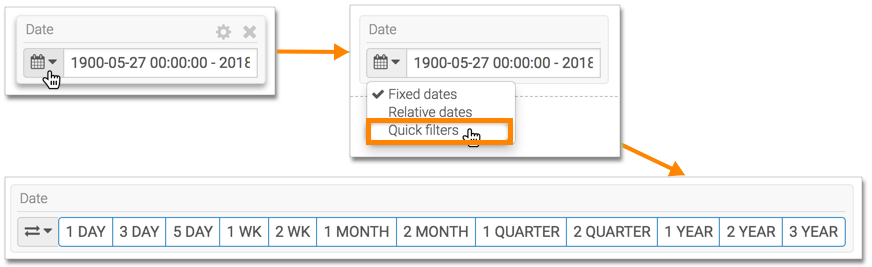
Click the Calendar icon on the filter and select
Quick filters from the menu.
The appearance of the filter changes to show the set of custom date ranges.
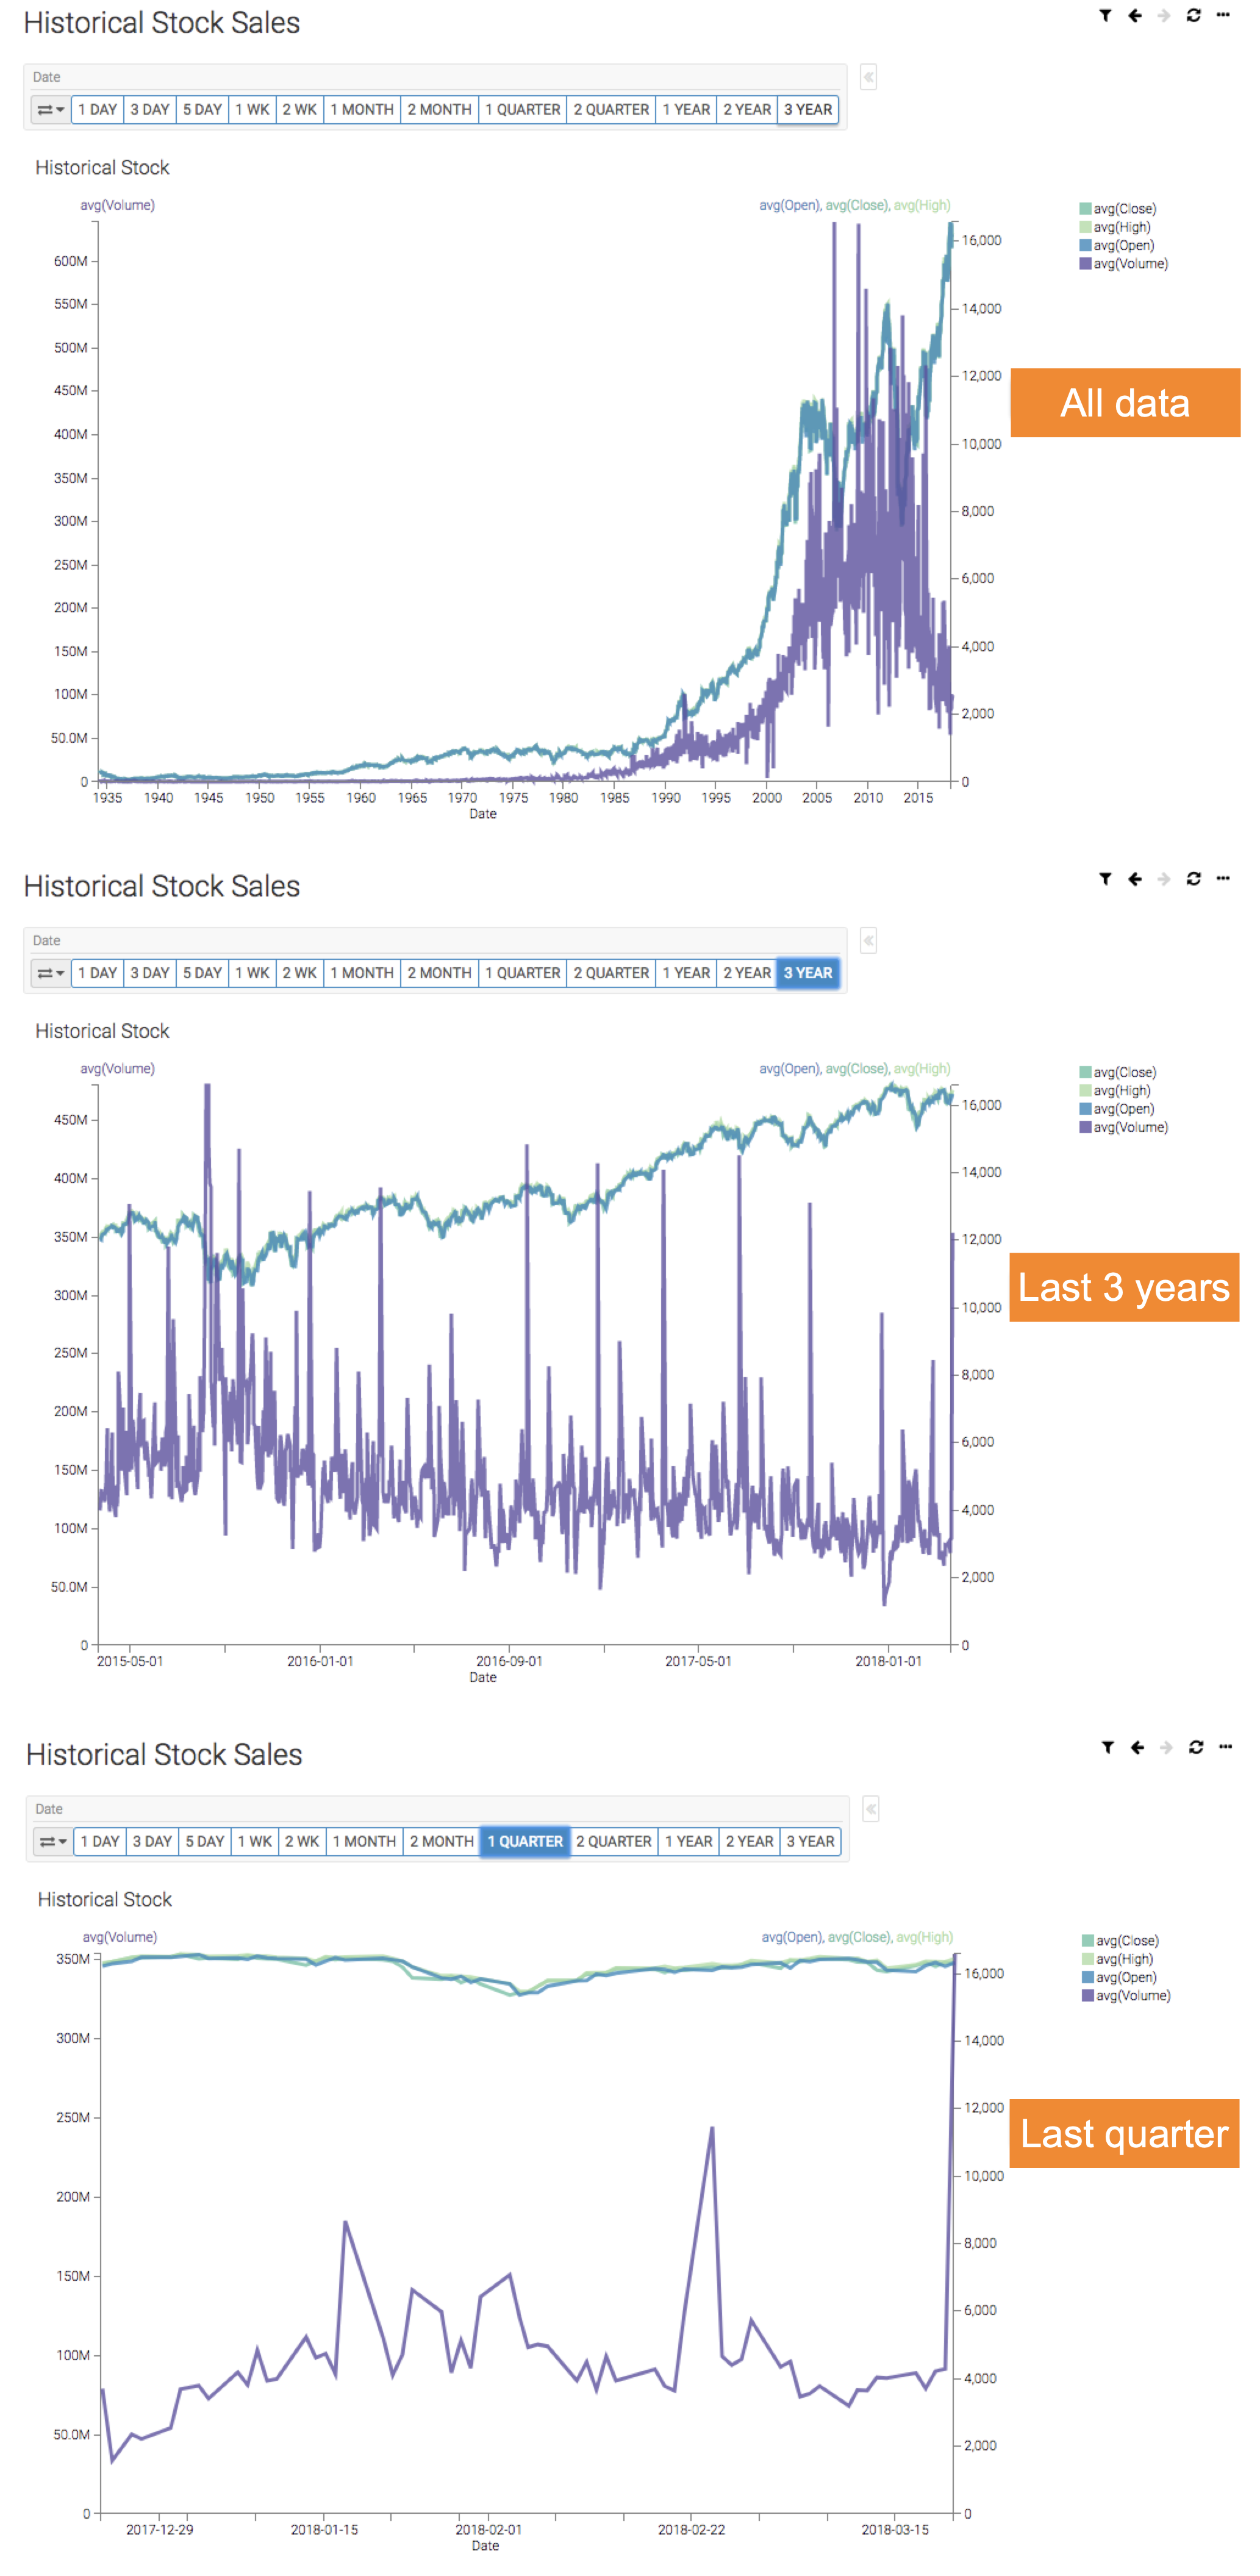
In these examples, you can see how the visual changes when the following filter date ranges are applied: none (all data), 3 years, and 1 quarter.