Creating custom colors with gradient values
In Cloudera Data Visualization, users with administrative role can define custom color palettes that are gradients, based on a value.
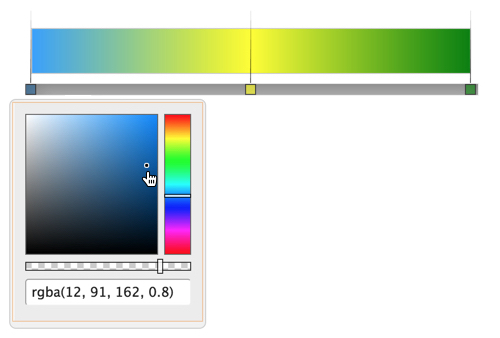
Perform these actions in the New Custom Color interface:
-
On the color bar, click the color indicator on the left (the red square over the gray
bar).
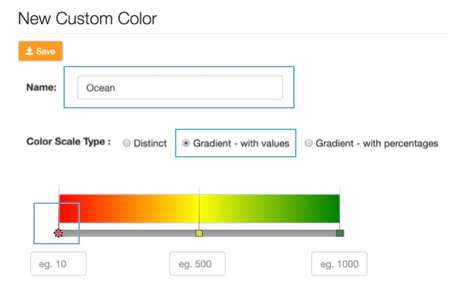
The color selection widget appears.
-
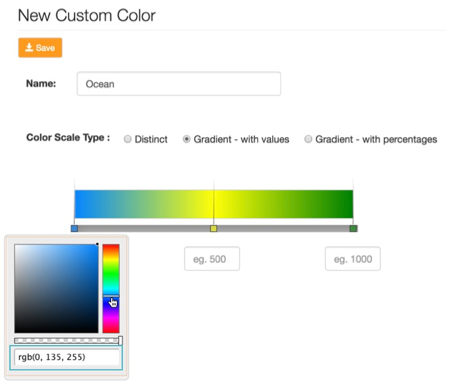
Point to another color and click it.
You can also enter the color as RGB values or in hexadecimal format.
-
To adjust the color shade, slide indicator on the shade bar to the left.
Values more to the left are progressively more 'Grey'. Placing the indicator on the extreme right (default position) generates the most intense color.
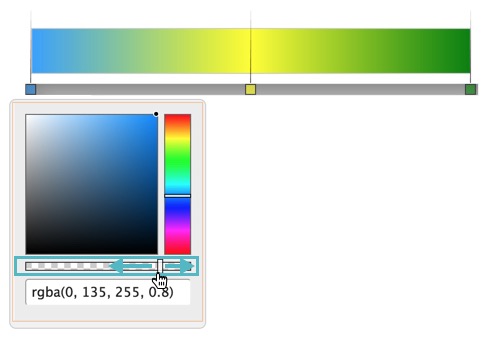
Another option for color selection is to manually adjust the color by dragging the black dot on the square color selection field to the desired location.
-
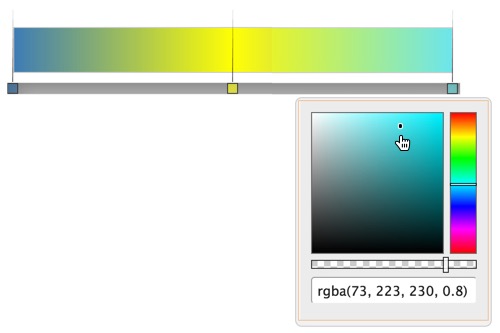
Configure the color on the right side of the color gradient.
-
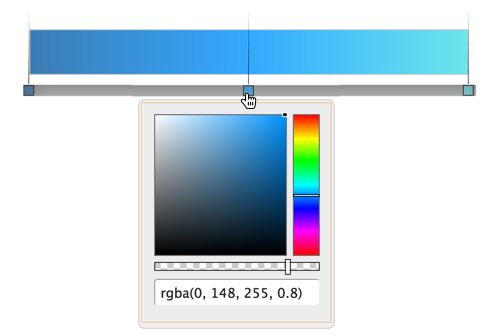
Configure the color in the middle of the color gradient.
- Optional:
You can adjust the position of the middle color by sliding its indicator to the left or
the right of the color gradient.
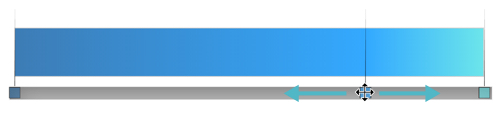
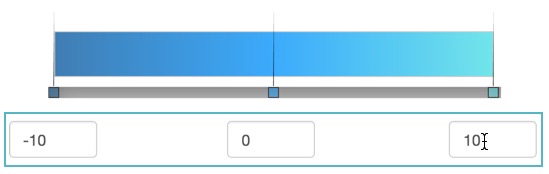
In the text fields under the color gradient, the three color indicators specify the values that correspond to the range and midpoint values in the data you plan to represent by the custom color.