Changing visible zoom levels in heatmap
In an interactive map visual on MapBox, it is recommended to adjust the zoom level within the minimum and maximum zoom levels. Valid values are 0 through 22. For example, if the zoom level is set to more than the maximum level, heatmap will not be visible.
Sometimes, it is not possible to display data legibly at a given zoom level. Cloudera Data Visualization enables you to adjust the visible zoom levels in a heatmap.
- In the Settings menu, click
Heatmap.
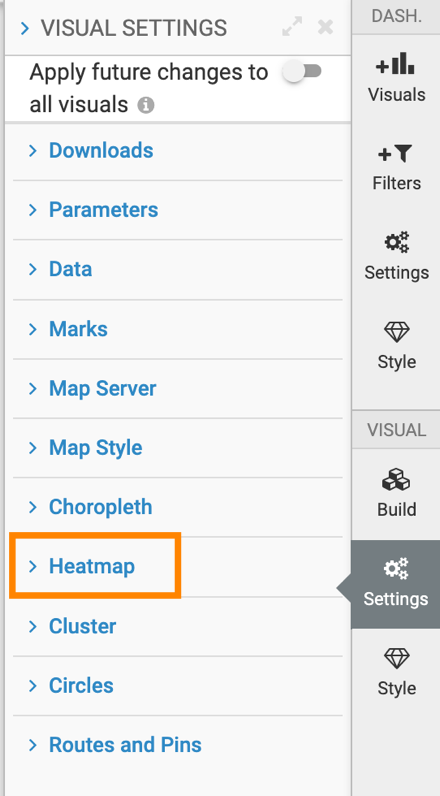
- To adjust the zoom level of a heatmap, navigate to the
Heatmap menu under Settings, and adjust
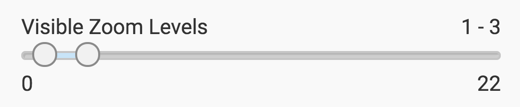
the minimum and maximum values in the Visible Zoom Levels option.
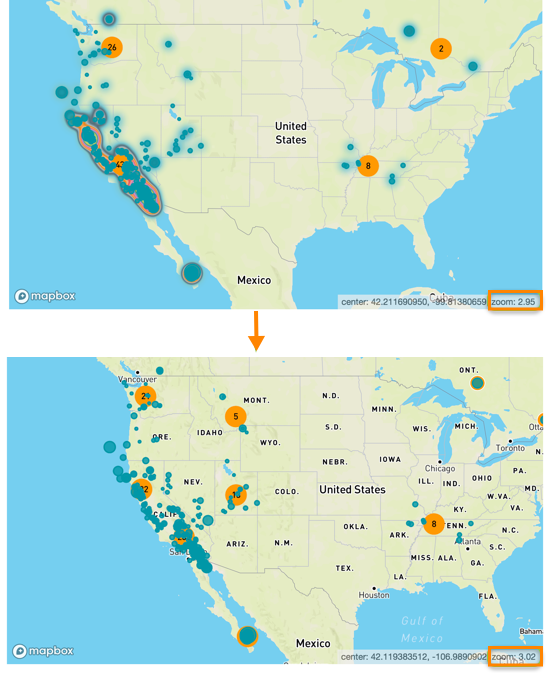
Let's set the minimum level to 1 and maximum level to 3.
In the following example, notice when the zoom level is set to a value less than the maximum level 2.95, heatmap is visible. However, if the zoom level is set to more than the maximum level 3.02, heatmap is not visible and the circles are smaller.