Changing display to overlap
This task applies to Radial Charts.
To view radial plots as full circles instead of wedges, navigate to the Marks menu, and select the Overlap marks option.

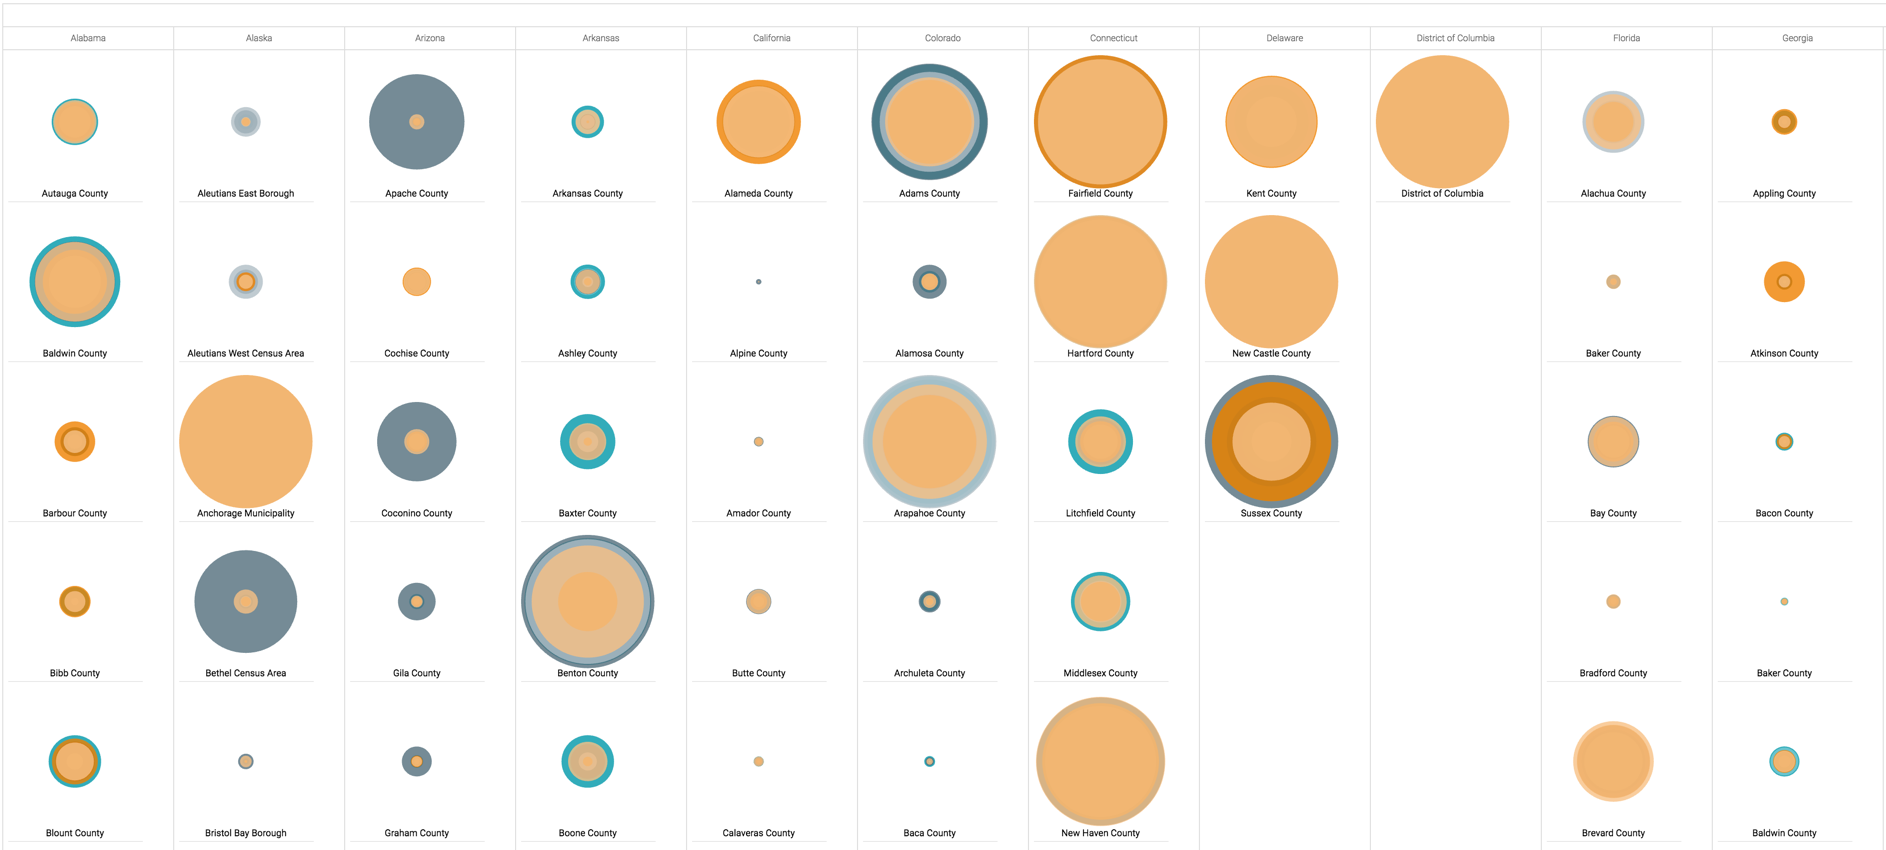
Here is a radial visual with default display.
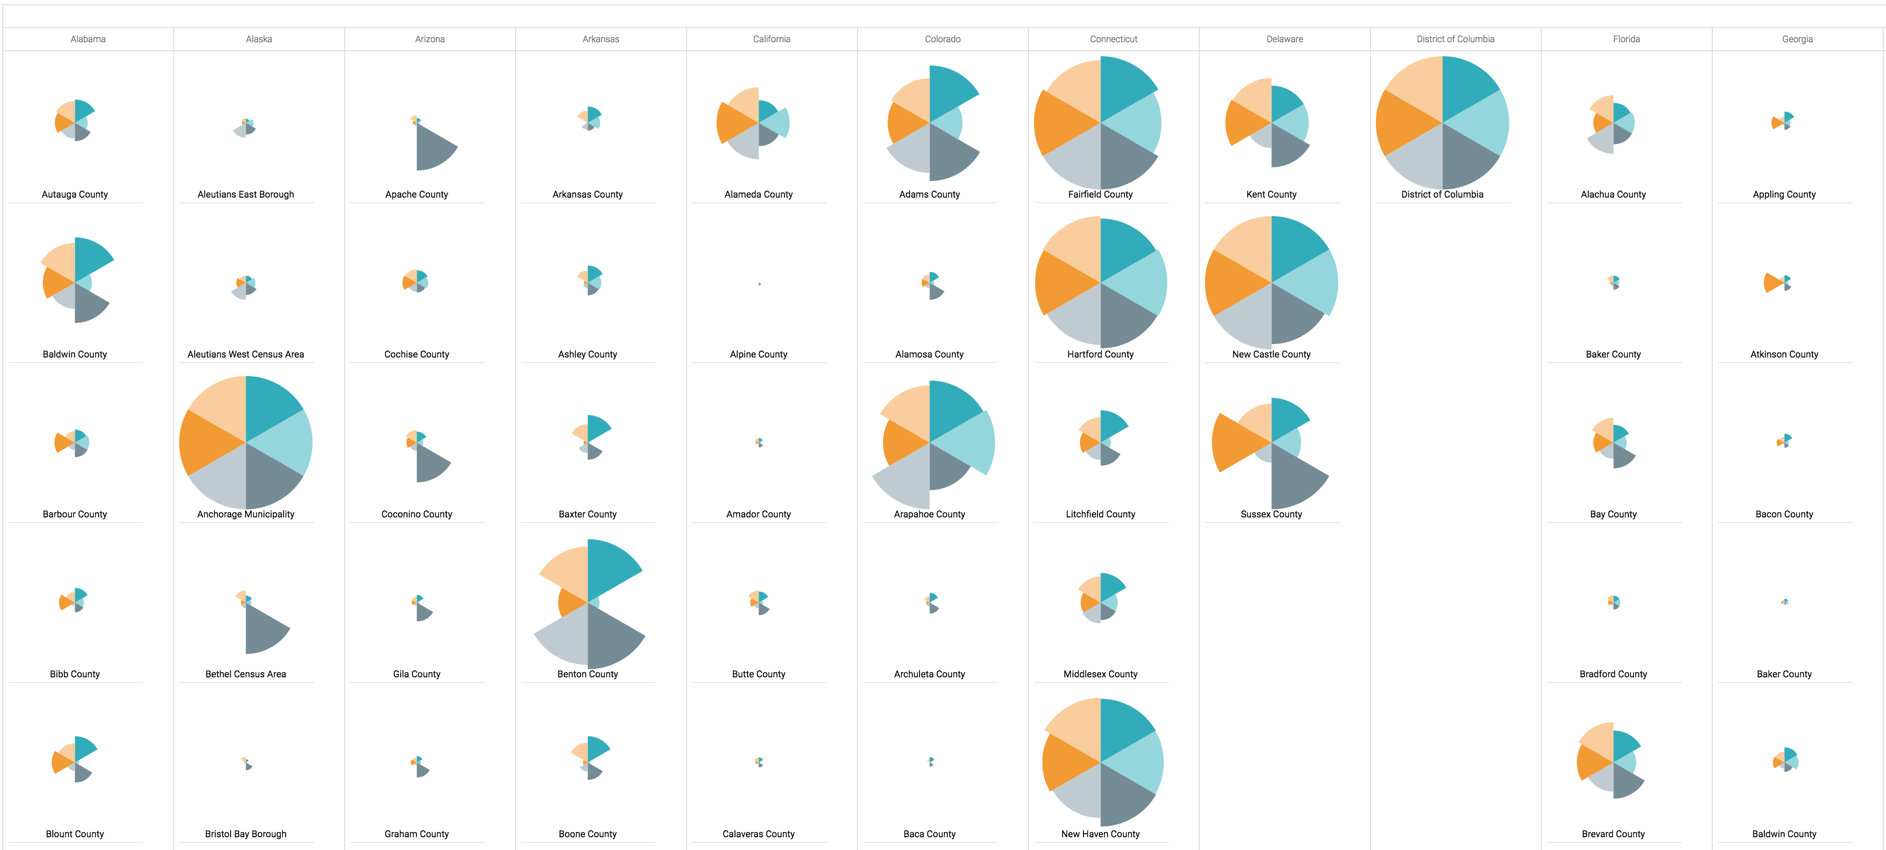
Note how turning on the overlap option changes the visual.