Current Load
Logs and Usage is a powerful monitoring interface that can help you better understand how users are engaging with Cloudera Data Visualization within your organization. The different tabs provide you detailed information on various aspects, including user activities, system load, and runtime performance. The Current Load tab of the interface offers the convenience of viewing essential information in real-time and provides a quick way to manage ongoing queries by canceling them if needed.
You can access the Current Load view through .
-
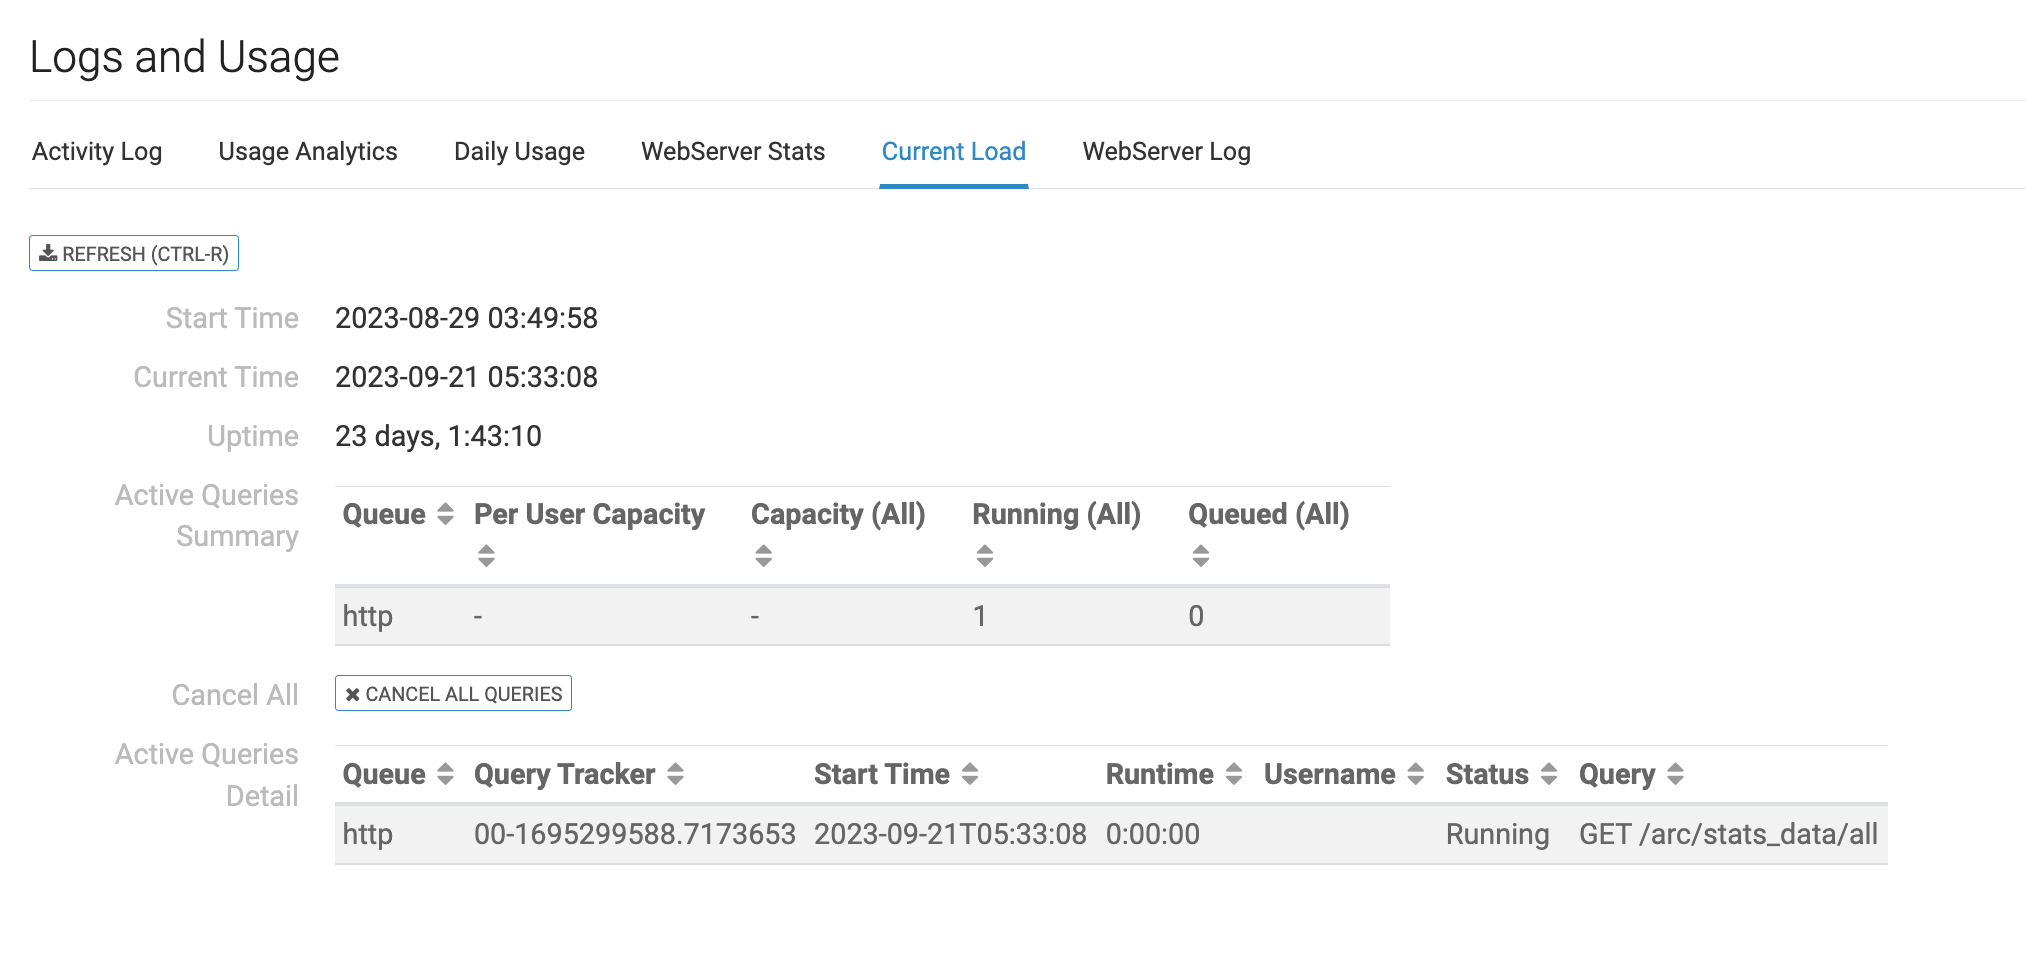
Data duplicated from WebServer Stats: Start Time, Current Time, Uptime, and Active Queries Detail.
-
Active Queries Summary presenting aggregated data for all users. It is a consolidated view of the system's load but does not provide user-specific details.
-
Option to cancel all queries currently in progress.